Hi,
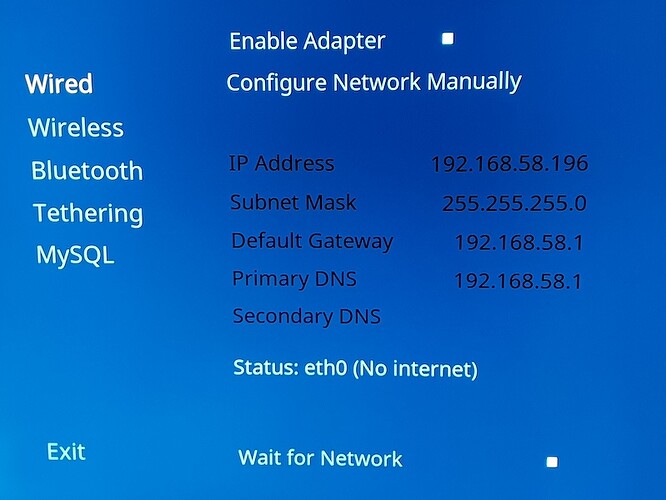
I’m having very weird issues with my gigabit ethernet connection on my Vero4K+.
This started right after I reinstalled OSMC from a SD card (although I think reinstalling OSMC might not be related at all).
The symptoms are the following:
- When I connect an ethernet cable, gigabit LED on my ethernet switch turns on, Vero4K+ gets an IP from the DHCP server, but it says “Status: eth0 (No internet)”.
- I tried with several cables that work with other devices, I tried connecting directly to my router (which has a 4 ports switch), it fails the same way.
- Vero4K+ cannot connect to the internet.
- Vero4K+ cannot be pinged from the local network!
- If I disable then re-enable the wired adapter from OSMC, it eventually connects after trying a dozen of times!
- As far as I saw, the issue does not occur with the wifi adapter (I only ran one test).
osmc@osmc:~$ uname -a
Linux osmc 3.14.29-117-osmc #1 SMP Mon Sep 3 00:16:47 UTC 2018 aarch64 GNU/Linux
I ran iperf (from my laptop which is on wifi, its TX rate is 700Mbps) after having managed to connect the Vero4K+ to LAN, and it looks good to me:
$ iperf3 -R -c 192.168.58.8
Connecting to host 192.168.58.8, port 5201
Reverse mode, remote host 192.168.58.196 is sending
[  5] local 192.168.58.240 port 59629 connected to 192.168.58.196 port 5201
[ ID] Interval           Transfer     Bitrate
[  5]   0.00-1.00   sec  38.8 MBytes   326 Mbits/sec
[  5]   1.00-2.00   sec  59.9 MBytes   502 Mbits/sec
[  5]   2.00-3.00   sec  60.6 MBytes   508 Mbits/sec
[  5]   3.00-4.00   sec  56.4 MBytes   473 Mbits/sec
[  5]   4.00-5.00   sec  58.0 MBytes   487 Mbits/sec
[  5]   5.00-6.00   sec  57.7 MBytes   484 Mbits/sec
[  5]   6.00-7.00   sec  58.3 MBytes   489 Mbits/sec
[  5]   7.00-8.00   sec  59.7 MBytes   501 Mbits/sec
[  5]   8.00-9.00   sec  59.8 MBytes   502 Mbits/sec
[  5]   9.00-10.00  sec  58.1 MBytes   487 Mbits/sec
- - - - - - - - - - - - - - - - - - - - - - - - -
[ ID] Interval           Transfer     Bitrate         Retr
[  5]   0.00-10.00  sec   570 MBytes   478 Mbits/sec   27             sender
[  5]   0.00-10.00  sec   567 MBytes   476 Mbits/sec                  receiver

iperf Done.
ifconfig eth0 says:
osmc@osmc:~$ ifconfig eth0
eth0: flags=-28605<UP,BROADCAST,RUNNING,MULTICAST,DYNAMIC>  mtu 1500
        inet 192.168.58.8  netmask 255.255.255.0  broadcast 192.168.58.255
        ether c4:4e:ac:28:28:cf  txqueuelen 1000  (Ethernet)
        RX packets 5999  bytes 1842291 (1.7 MiB)
        RX errors 0  dropped 29  overruns 0  frame 0
        TX packets 3352  bytes 419053 (409.2 KiB)
        TX errors 0  dropped 0 overruns 0  carrier 0  collisions 0
        device interrupt 40
netstat -i says:
osmc@osmc:~$ netstat -i
Kernel Interface table
Iface      MTU    RX-OK RX-ERR RX-DRP RX-OVR    TX-OK TX-ERR TX-DRP TX-OVR Flg
eth0      1500  1017221      0    397 0       1426302      0      0      0 BMdRU
lo        4096      224      0      0 0           224      0      0      0 LRU
netstat -s says:
osmc@osmc:~$ netstat -s
Ip:
    Forwarding: 2
    1015225 total packets received
    38 with invalid addresses
    0 forwarded
    0 incoming packets discarded
    1015175 incoming packets delivered
    222845 requests sent out
    56 outgoing packets dropped
    693 dropped because of missing route
    24 reassemblies required
    12 packets reassembled ok
Icmp:
    115 ICMP messages received
    0 input ICMP message failed
    ICMP input histogram:
        destination unreachable: 112
        echo requests: 3
    115 ICMP messages sent
    0 ICMP messages failed
    ICMP output histogram:
        destination unreachable: 112
        echo replies: 3
IcmpMsg:
        InType3: 112
        InType8: 3
        OutType0: 3
        OutType3: 112
Tcp:
    469 active connection openings
    17 passive connection openings
    0 failed connection attempts
    2 connection resets received
    1 connections established
    1002103 segments received
    1419325 segments sent out
    179 segments retransmitted
    0 bad segments received
    3 resets sent
Udp:
    10151 packets received
    112 packets to unknown port received
    0 packet receive errors
    1980 packets sent
    0 receive buffer errors
    0 send buffer errors
UdpLite:
TcpExt:
    19 TCP sockets finished time wait in fast timer
    1 packetes rejected in established connections because of timestamp
    25 delayed acks sent
    Quick ack mode was activated 7 times
    64 packets directly queued to recvmsg prequeue
    1012152 bytes directly in process context from backlog
    TCPDirectCopyFromPrequeue: 365249
    827486 packet headers predicted
    966 packet headers predicted and directly queued to user
    138211 acknowledgments not containing data payload received
    29796 predicted acknowledgments
    TCPSackRecovery: 7
    7 congestion windows recovered without slow start after partial ack
    137 fast retransmits
    6 forward retransmits
    TCPTimeouts: 21
    TCPLossProbes: 22
    TCPLossProbeRecovery: 2
    TCPDSACKOldSent: 7
    TCPDSACKOfoSent: 2
    TCPDSACKRecv: 9
    2 connections reset due to early user close
    7 connections aborted due to timeout
    TCPDSACKIgnoredNoUndo: 1
    TCPSackShifted: 6477
    TCPSackMerged: 682
    TCPSackShiftFallback: 413
    TCPRetransFail: 14
    TCPRcvCoalesce: 629382
    TCPOFOQueue: 3318
    TCPOFOMerge: 1
    TCPSpuriousRtxHostQueues: 2
    TCPAutoCorking: 4902
IpExt:
    InMcastPkts: 10200
    OutMcastPkts: 1194
    InBcastPkts: 286
    InOctets: 1259039741
    OutOctets: 1807734075
    InMcastOctets: 3189137
    OutMcastOctets: 291762
    InBcastOctets: 39194
    InNoECTPkts: 1015662
I am not sure that the issue comes from the Vero4K+, maybe I have a glitch on my network (at some point I thought there was an IP conflict, but there isn’t)…
Any idea?
Ben.


