I just experienced the bug while running ‘OSMC_TGT_rbp1_20150830.img’ with kernel 4.2.3-3-osmc, so it appears that the error does not lie with Kodi 15.2 after all.
Another freeze-up on ‘OSMC_TGT_rbp1_20150830.img’/kernel 4.2.3-3-osmc. However, this time I immediately tried to establish an ssh connection. As expected, this woke OSMC up, however I caught a brief glimpse of an on-screen message along the lines of: “Pulse-Eight CEC Adapter: connection lost.” The system then proceeded to fast-forward to a point that presumably corresponded to where I’d been, had playback not frozen up. Playback was normal from here on, but CEC was gone.
Now, here’s the kicker: I used the Kore Remote app to go to: Settings>System>Input devices>Peripherals. This lists a single unit:
CEC Adapter
Product ID: 1001
Vendor: 2708
Class: cec
(I am using a Sony RM-ED035 with my KDL-EX501 telly.)
Opening the config page for the unit did not nothing, and neither did saving with no changes. However, when I disabled the unit and saved, the remote suddenly worked again (despite the config page now indicating it as disabled)?! In fact, enabling and disabling it now seemed to do nothing at all.
Update 1: I continued to use the system, and the same thing happened. This time toggling the CEC config did not revive the remote, however.
Update 2: CEC was not restored upon rebooting. I assumed this was because I had left the config on ‘disabled’, but enabling it did not restore CEC. Using Power>Exit fixed the issue.
I am commenting to rule out NFS shares, since i am running on ftp and this mute-freeze happens a couple of times a day, and very unpredictably. still trying to trace solid steps to replicate it.
I’m seeing the same crashes here. Muting, than freezing. The power supply is ok, has been working for years. No remote file systems were in use. No remote control was connected, just a usb keyboard. After the crash, there is nothing in the logs. SSH is timing out, while the Pi still sends echo replies. Kodi doesn’t remember the timestamp of the crash (doesn’t offer to resume the video at the point where it froze). This happens with h264 and mpeg2 files.
I’ve just upgraded to the 1.9.7 kernel package and will check if problem still persists.
If it does, I’ll try to downgrade the kernel to find out a working version.
Best
Hartmut
(This is the last log entry before the freeze-up; the entries immediately following this one are shown below)
I waited for 2 minutes to see if the system would un-freeze itself (I used a timer). When it didn’t I logged in via ssh, which immediately made it pace forward to the timepoint it should have reached, had it not been frozen:
At this point CEC is always dead, so I used the Kore Remote app to reboot the system; this accounts for the remaining entries in the log.
A few notes:
0830 w/4.2.3-3-osmc is definitely affected by the CEC-freeze bug.
Waking the frozen system by accessing it with ssh has not yet failed me with Kodi 15.1, but it seems a bit hit-and-miss once Kodi 15.2 is installed. It appears that Kodi 15.2 exacerbates the effects of the CEC-freeze bug.
I propose we focus on 0830/4.2.3-3-osmc for the time being. Is there any way to log more details surrounding the freeze-ups? Should I enable component-specific logging of some or all components?
P.S.: I’ve not been able to get grab-logs to work on this installation (‘command not found’); can anyone confirm?
I notice that there’s a couple of closing <body> tags in the former snippet, one of which is even marked with a ‘FATAL’ parsing error.
Similarly, there are a number of ‘expiration time renewed’ entries for my gateway.
However, every single log entry in the first snippet (i.e. before the lock-up) is also present in the log following the 19:12 timepoint. I conclude that the log doesn’t immediately give away what it is that triggers this bug.
Finally, we see that the CEC thread is killed off after the machine has been thawed out?!
I think I’ll try and see if the issue persists if the movie is located on the SD card or on a USB stick. This should tell us if this is a network error of some sort.
Update: OSMC just froze on me while playing a movie from a USB drive (I’ve used a Synology NAS w/Samba so far), so the issue does not seem to be network-related.
Edit: I forgot to mention that I was unable to revive the machine by ssh this time; perhaps this trick only works if you manage to do it within a brief period after OSMC freezes?
Here is a full set of logs captured while the muting-then-freezing phenomenon appeared at about 1:00 on Dec 09. Tried to log in in via ssh after the freeze, initially unsuccessful, then successful. After a couple of minutes Kodi restarted automatically.
Notable Kodi Old Log lines at freeze time:
00:59:02 435070.187500 T:1957708336 DEBUG: LIRC: Update - NEW at 174009181:72 0 KEY_VOLUMEDOWN linux-input-layer (KEY_VOLUMEDOWN) 00:59:02 435070.187500 T:1957708336 DEBUG: OnKey: rightctrl (0xd1) pressed, action is VolumeDown 00:59:05 435072.562500 T:932181024 WARNING: CRenderManager::WaitForBuffer - timeout waiting for buffer 01:00:08 435135.562500 T:1646261280 WARNING: Previous line repeats 3 times. 01:00:09 435136.906250 T:1646261280 DEBUG: EPG - UpdateFromScraper - updating EPG for channel 'Hamburg 1' from client '797' 01:00:09 435137.156250 T:844100640 DEBUG: CDVDPlayer::OMXDoProcessing Pause -55.86,-51.40 (A:10 V:10) EOF:0 FULL:0 T:0.40 01:00:09 435137.156250 T:844100640 DEBUG: OMXClock::OMXSetSpeed(0.000) pause_resume:1 01:00:27 435155.375000 T:1646261280 DEBUG: EPG - UpdateFromScraper - updating EPG for channel 'MDR FERNSEHEN' from client '797' 01:00:45 435172.781250 T:1957708336 DEBUG: LIRC: Update - NEW at 174111011:72 0 KEY_VOLUMEDOWN_UP linux-input-layer (KEY_VOLUMEDOWN_UP) 01:01:08 435195.906250 T:1646261280 DEBUG: EPG - UpdateFromScraper - updating EPG for channel 'NDR FS HH' from client '797' 01:05:09 435436.593750 T:1957708336 DEBUG: LIRC: Update - NEW at 174347884:72 0 KEY_VOLUMEDOWN linux-input-layer (KEY_VOLUMEDOWN) 01:05:25 435453.343750 T:1957708336 DEBUG: OnKey: rightctrl (0xd1) pressed, action is VolumeDown
Notable journal lines at the time of freeze:
Dec 09 00:27:58 mc-wohnzimmer kernel: lirc_rpi: AIEEEE: 0 0 5667677e 56676664 902cb 9a84f Dec 09 01:01:23 mc-wohnzimmer sshd[14187]: Accepted password for root from 192.168.178.38 port 39082 ssh2 Dec 09 01:01:48 mc-wohnzimmer kernel: lirc_rpi: AIEEEE: 1 1 56676f6a 56676ed0 aef94 2fb8e Dec 09 01:02:07 mc-wohnzimmer sshd[14187]: pam_unix(sshd:session): session opened for user root by (uid=0) Dec 09 01:02:34 mc-wohnzimmer sshd[14187]: pam_systemd(sshd:session): Failed to create session: Connection timed out Dec 09 01:03:21 mc-wohnzimmer sshd[14187]: Received disconnect from 192.168.178.38: 11: Closed due to user request. Dec 09 01:03:23 mc-wohnzimmer sshd[14187]: pam_unix(sshd:session): session closed for user root Dec 09 01:03:58 mc-wohnzimmer systemd[1]: systemd-logind.service watchdog timeout (limit 1min)! Dec 09 01:04:02 mc-wohnzimmer systemd[1]: Unit systemd-logind.service entered failed state.
Your system is running right out of memory, such that the OOM (out of memory) killer starts terminating processes:
Dec 09 01:05:53 mc-wohnzimmer kernel: sshd invoked oom-killer: gfp_mask=0x200d2, order=0, oom_score_adj=0
Dec 09 01:05:53 mc-wohnzimmer kernel: sshd cpuset=/ mems_allowed=0
Dec 09 01:05:53 mc-wohnzimmer kernel: CPU: 0 PID: 14214 Comm: sshd Tainted: G         C      4.3.0-10-osmc #1
Dec 09 01:05:53 mc-wohnzimmer kernel: Hardware name: BCM2709
Dec 09 01:05:53 mc-wohnzimmer kernel: [<8001f730>] (unwind_backtrace) from [<8001afdc>] (show_stack+0x20/0x24)
Dec 09 01:05:53 mc-wohnzimmer kernel: [<8001afdc>] (show_stack) from [<80400b7c>] (dump_stack+0x9c/0xdc)
Dec 09 01:05:53 mc-wohnzimmer kernel: [<80400b7c>] (dump_stack) from [<801d1b78>] (dump_header+0xb0/0x208)
Dec 09 01:05:53 mc-wohnzimmer kernel: [<801d1b78>] (dump_header) from [<80161acc>] (oom_kill_process+0x268/0x458)
Dec 09 01:05:53 mc-wohnzimmer kernel: [<80161acc>] (oom_kill_process) from [<801620c8>] (out_of_memory+0x3c4/0x408)
Dec 09 01:05:53 mc-wohnzimmer kernel: [<801620c8>] (out_of_memory) from [<801698c4>] (__alloc_pages_nodemask+0xa6c/0xab8)
Dec 09 01:05:53 mc-wohnzimmer kernel: [<801698c4>] (__alloc_pages_nodemask) from [<801e317c>] (pipe_write+0x25c/0x4c8)
Dec 09 01:05:53 mc-wohnzimmer kernel: [<801e317c>] (pipe_write) from [<801d7a74>] (SyS_write+0x224/0x3f8)
Dec 09 01:05:53 mc-wohnzimmer kernel: [<801d7a74>] (SyS_write) from [<80016d40>] (ret_fast_syscall+0x0/0x1c)
Dec 09 01:05:53 mc-wohnzimmer kernel: Mem-Info:
Dec 09 01:05:53 mc-wohnzimmer kernel: active_anon:170858 inactive_anon:2360 isolated_anon:0
                                       active_file:1705 inactive_file:1874 isolated_file:0
                                       unevictable:0 dirty:0 writeback:0 unstable:0
                                       slab_reclaimable:1418 slab_unreclaimable:2420
                                       mapped:1355 shmem:2440 pagetables:650 bounce:0
                                       free:3943 free_pcp:129 free_cma:935
Once this happens, all bets are off, the system will start malfunctioning until a reboot. Don’t worry too much about which process it claims triggered it - that is only the process that tried to allocate memory when there was no memory left and is not necessarily the process(s) to blame for running the system out of memory.
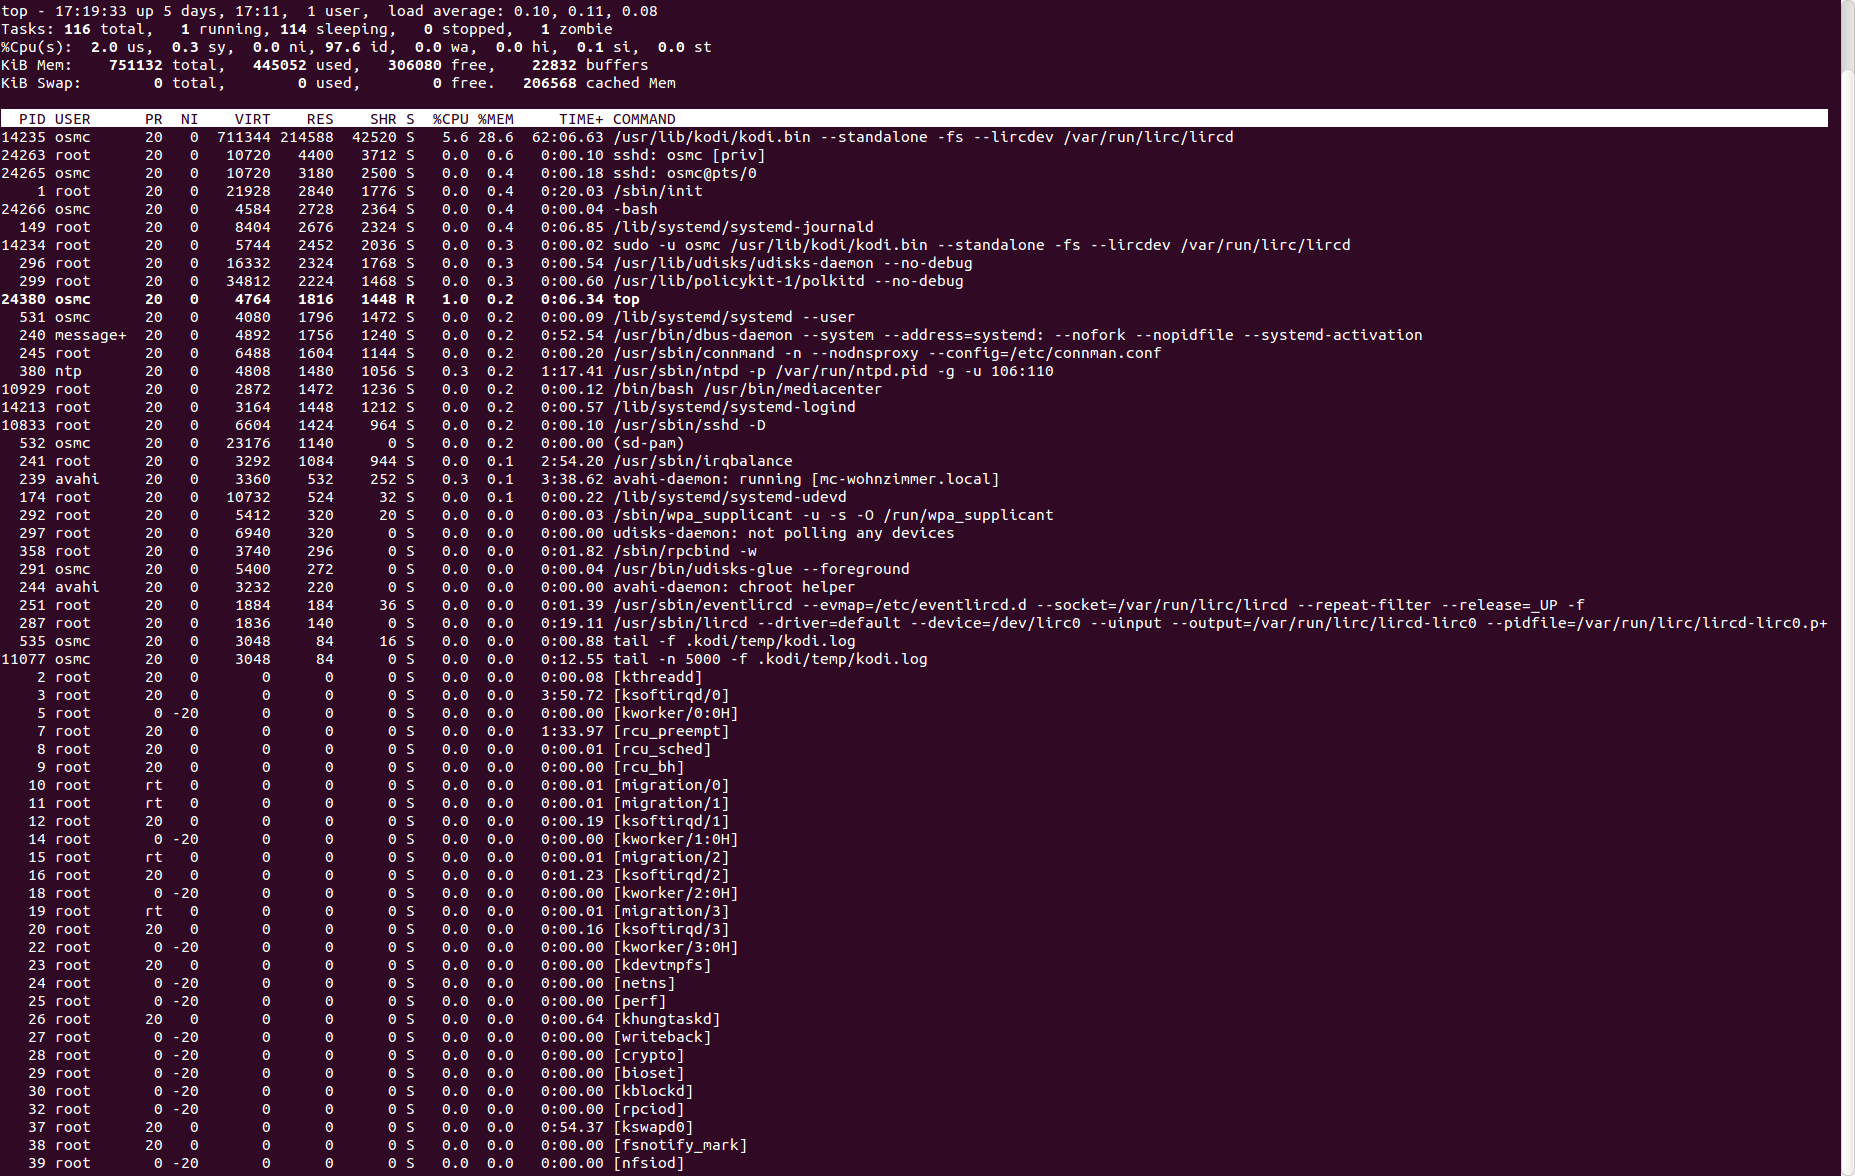
You need to find what is consuming all memory. I would open an SSH session and launch ‘top’, then customise it as follows:
Press ‘c’ to show the full command line of processes, then press ‘M’ (capital M) to sort by memory usage, then press ‘W’ (capital W) to save these preferences. In future whenever you start top it will automatically start with these options so that processes are sorted by memory use and full command lines are shown.
Then just leave top running in an SSH session while you use OSMC normally, and watch the memory use of the processes. The column of interest is “RES” which is “resident set size” in Kilobytes, or how much physical memory that process is currently using.
Kodi will be the biggest memory user and by default it will typically consume between about 80MB and 120MB depending on what you are doing. If you see it going much past 150MB or so this is cause for concern. If some other program starts using a lot more memory than Kodi that is also cause for concern.
A Pi 2 has 1GB of ram, by default with 256MB allocated to the GPU, leaving 768MB available to the OS - it’s very unusual for a Pi 2 to run out of memory on OSMC unless you have installed a lot of background/3rd party software and one of those programs has gone crazy and started consuming loads of memory. Something like a torrent client is the most likely culprit.
If you have, it would be useful to list what background software you have installed and running.
PS did you have subtitles enabled at the time ? If so does it happen with subtitles disabled ?
I have configured top as suggested and attached a current screenshot. Note that Kodi, but not the entire system has restarted since the freezing occurred. As you can see, after running for about 17 hours, Kodi’s resident set size is well beyond 200 MB.
I have installed nothing but OSMC/Kodi provided software from standard repositories. So it’s just the packages listed in the full log in pastebin (sections “OSMC Packages” and “All Other Packages”) and regular Kodi addons. If you need specific configuration files to confirm this, please let me know.
If I remember correctly, I have not touched subtitle settings at all, as I don’t use them. Subtitles are not displayed at all during playback. If I should check a specific setting, please ask.
200MB does seem a bit high - if possible leave your SSH session running, (or start it up again before you go to use OSMC) and keep an eye on that kodi memory use to see if it continues to climb and whether kodi is at the top of the list should you start seeing freezing again.
If free, buffers and cached mem at the top all start to drop really low then the system is about to run out of memory.
Used and free is obvious, however buffers and cached mem are not - they are memory being used for buffers and cache (ha!) which is memory that is in use, but can be freed when needed for applications.
So having a very low free figure by itself is not a concern if buffers and/or cached mem are both high, that just means that there is a lot of disk caching happening but those caches will be flushed when applications need memory. But if all three are low at once that is a concern.
OK, thanks, will do as suggested and monitor top output. I’ll reboot the Pi 2 first to make sure that everything is in place and there are no deviations resulting from oom killer actions.
I’ll get back to you as soon as I have new information. This might take a couple of days since the intervals between freezes over here have been varying from a couple of minutes to several days.
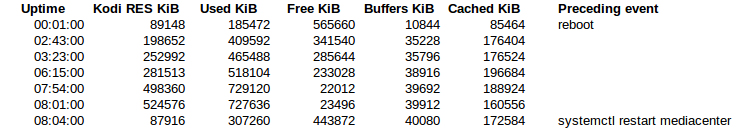
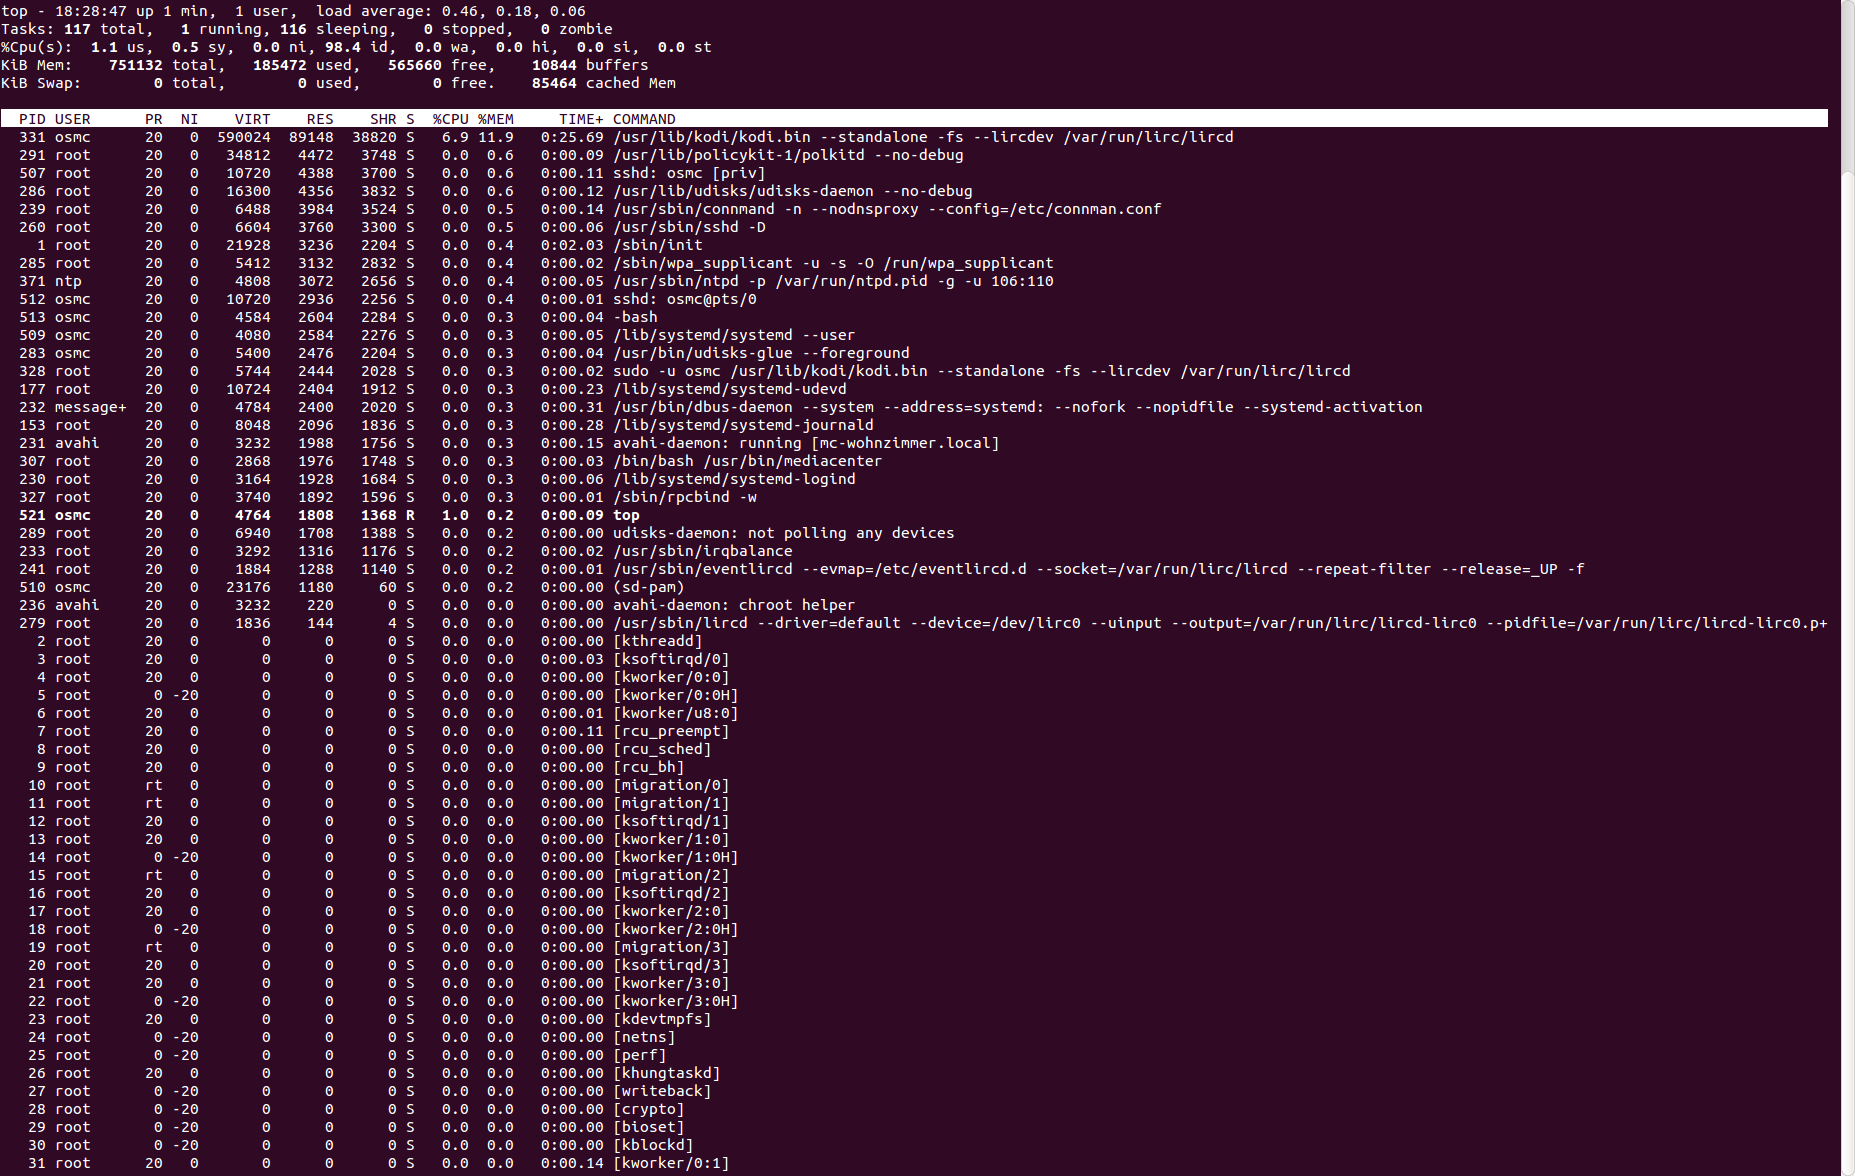
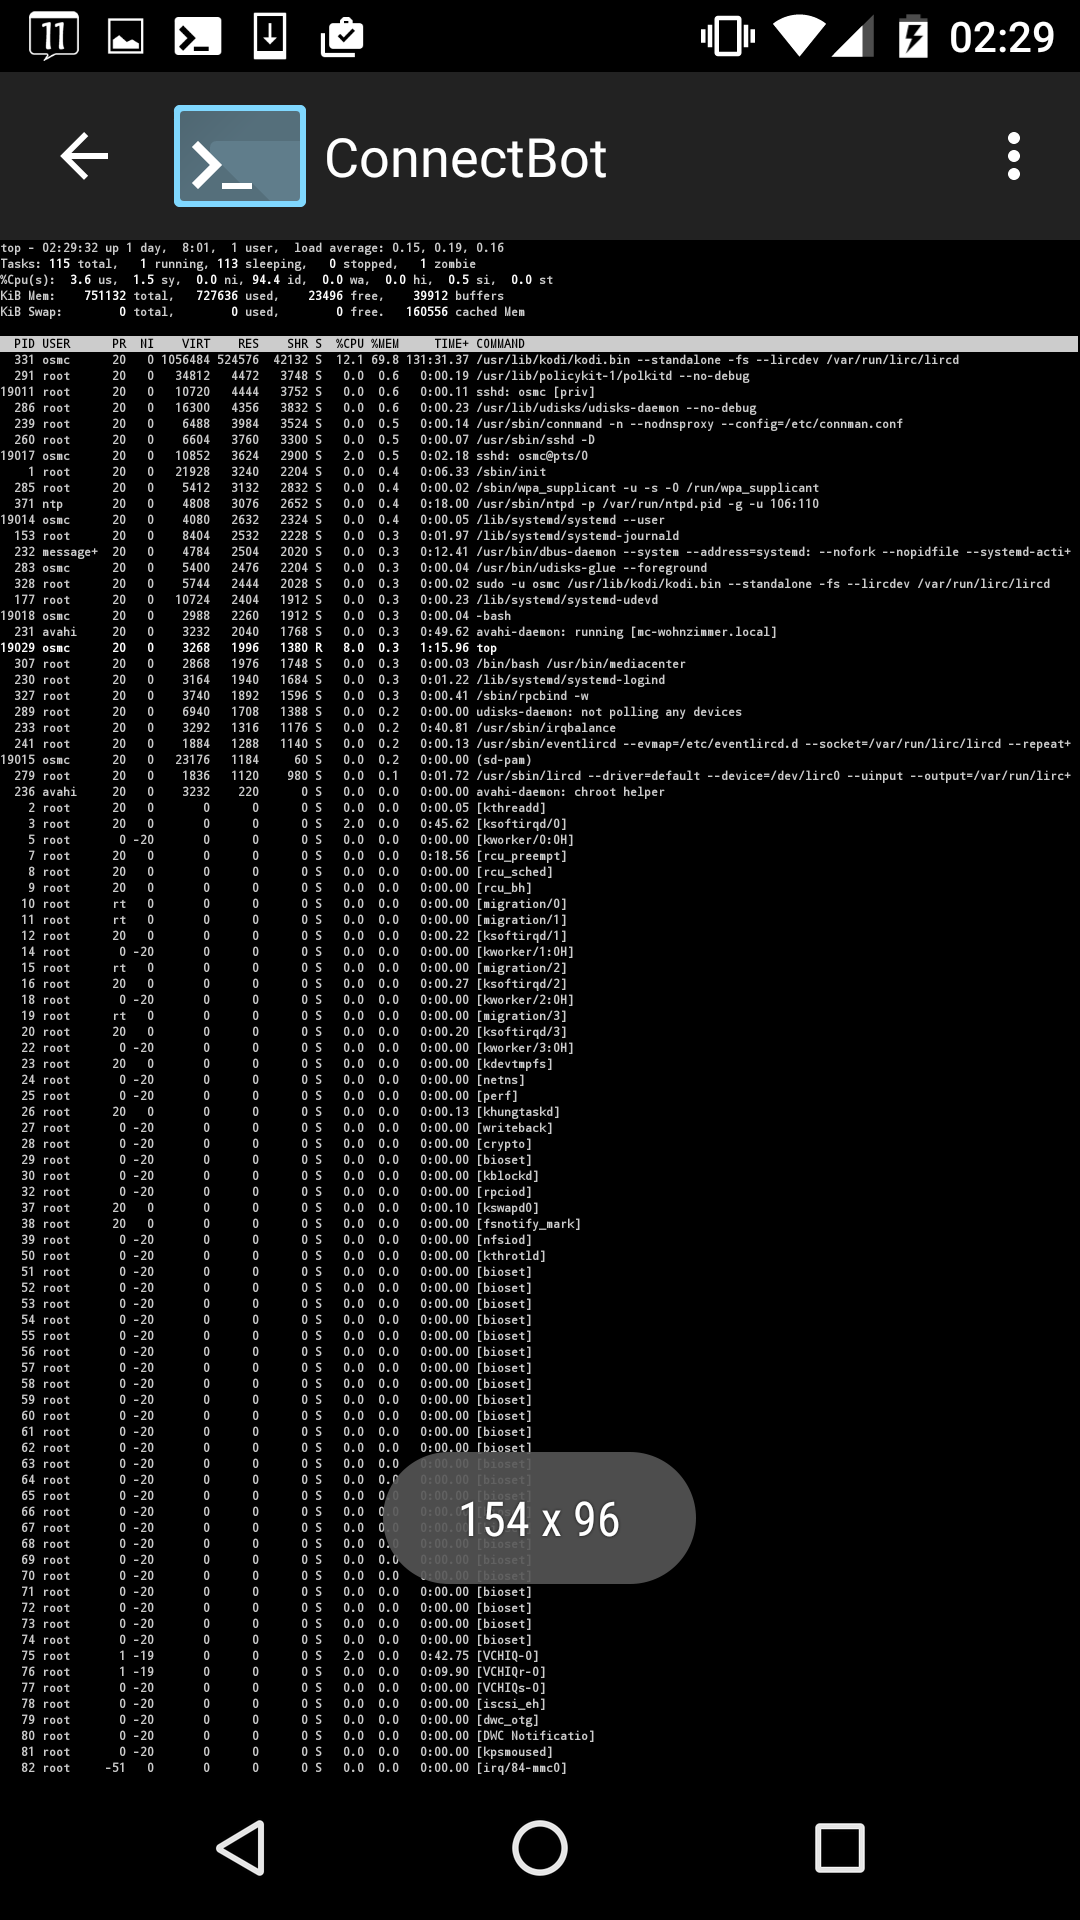
I didn’t wait until the system would run out of memory and Kodi would crash eventually, but restarted Kodi when free memory was finally low enough for the system to begin shrinking its cache.
I’ve observed memory consumption rising steadily during playback. When pausing the playback, memory consumption remained at a constant level to rise again as soon as playback was resumed.
All this is related to playback of TS video files (TVHeadend recordings) via the TV - Recordings GUI (with TVHeadend client installed). I’ve experimented with some variants and it looks like
playback with OMX player leaks more than with MMAL
playback via TV - Recordings leaks more than playback via Videos - Files
I just want to drop in, the problem occurs also when listening to a webradio (–> http-audio-stream). It happend for the 2nd or 3rd time today for me. I’m using a Pi2.
Do you need more log-files or other things to track this down? Or is the feedback from the other people enough for the moment?
Well Logs with debugging enabled always helps. Also as a quite likely reason might be memory watching the memory usage of Kodi always also helps to see if it maybe related.
@Oliver_O Can you confirm if leak occurs with omxplayer enabled/disabled?
If you can find a small file that shows the problem when played on repeat and upload it (e.g. to dropbox or google drive) then we can try to reproduce the problem.