Benchmarks
People might be curious to see what kind of performance can be expected from such a setup.
The environment is this:
- client: Vero 4k
- switch: Turris Omnia
- server: old Dual-core Intel E6500 server with Seagate ST4000DM000 4TB HDD
Everything is connected with gigabit, end to end.
First read of a 10MB file:
osmc@osmc:~$ dd if=/mnt/server/10M of=/dev/null
19531+1 enregistrements lus
19531+1 enregistrements écrits
10000000 bytes (10 MB, 9,5 MiB) copied, 1,03572 s, 9,7 MB/s
Subsequent reads are, obviously, easily cached:
osmc@osmc:~$ dd if=/mnt/server/10M of=/dev/null
19531+1 enregistrements lus
19531+1 enregistrements écrits
10000000 bytes (10 MB, 9,5 MiB) copied, 0,0420413 s, 238 MB/s
bonnie++ benchmarks:
Version  1.97       ------Sequential Output------ --Sequential Input- --Random-
Concurrency   1     -Per Chr- --Block-- -Rewrite- -Per Chr- --Block-- --Seeks--
Machine        Size K/sec %CP K/sec %CP K/sec %CP K/sec %CP K/sec %CP  /sec %CP
osmc             4G    25  22 16714  11  9056   5  1032  88 10748   2  1183  34
Latency               391ms     635ms    1348ms     254ms     259ms     212ms
Version  1.97       ------Sequential Create------ --------Random Create--------
osmc                -Create-- --Read--- -Delete-- -Create-- --Read--- -Delete--
              files  /sec %CP  /sec %CP  /sec %CP  /sec %CP  /sec %CP  /sec %CP
               1024   253   4   881   4   274   2   254   4   923   4   246   2
Latency              3260ms     981ms   17924ms    3472ms   55357us   30419ms
1.97,1.97,osmc,1,1548699449,4G,,25,22,16714,11,9056,5,1032,88,10748,2,1183,34,1024,,,,,253,4,881,4,274,2,254,4,923,4,246,2,391ms,635ms,1348ms,254ms,259ms,212ms,3260ms,981ms,17924ms,3472ms,55357us,30419ms
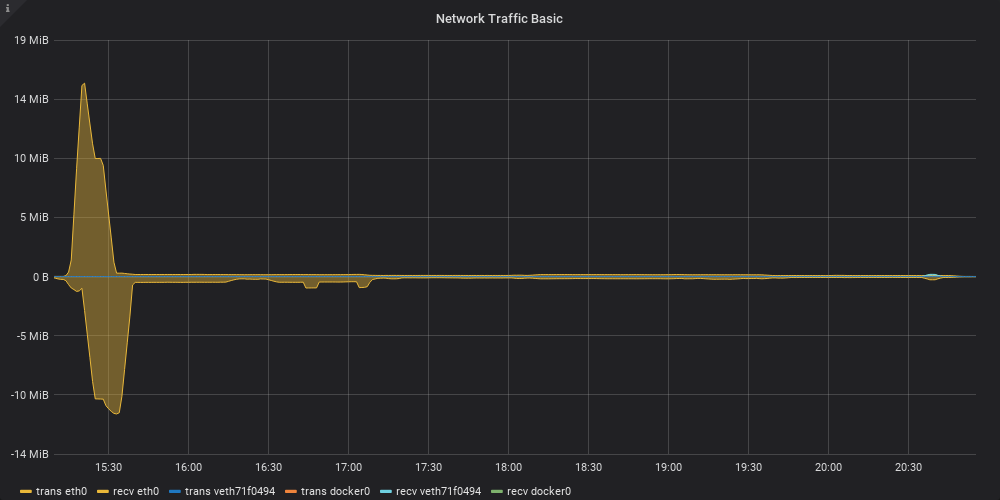
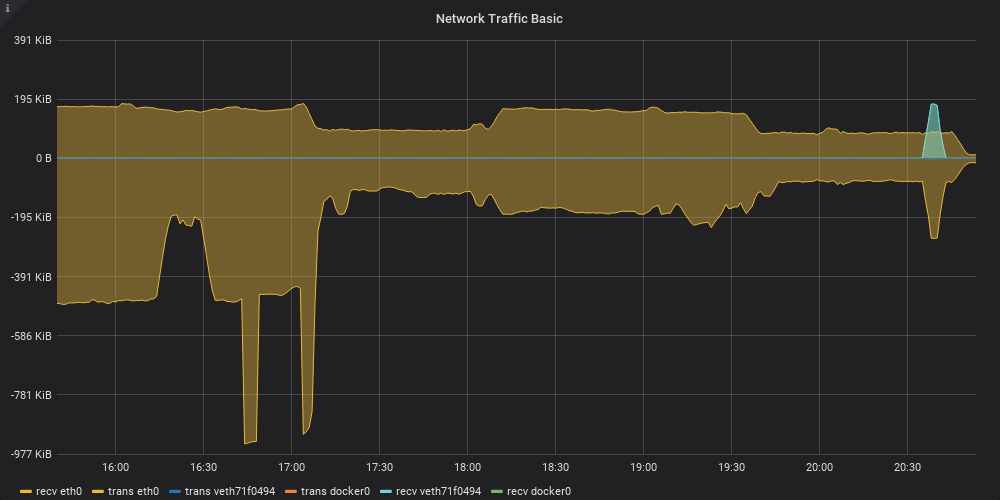
During the tests, top showed SSH and SSHFS each taking about 20% of a CPU with load around 1.5/1.6, so it seems like CPU is not much of a bottleneck, at first glance. The network was far from being saturated of course - it spiked at around 14MiB/s in the earlier parts of the test and then leveled down to a much slower ~200KiB/s:
Here’s the same benchmark performed directly on the server:
Version  1.97       ------Sequential Output------ --Sequential Input- --Random-
Concurrency   1     -Per Chr- --Block-- -Rewrite- -Per Chr- --Block-- --Seeks--
Machine        Size K/sec %CP K/sec %CP K/sec %CP K/sec %CP K/sec %CP  /sec %CP
server          16G   448  98 84327  12 45061   7  1112  90 86878   8  72.7   2
Latency             19506us    4374ms    4166ms   30304us     122ms    4964ms
Version  1.97       ------Sequential Create------ --------Random Create--------
server              -Create-- --Read--- -Delete-- -Create-- --Read--- -Delete--
              files  /sec %CP  /sec %CP  /sec %CP  /sec %CP  /sec %CP  /sec %CP
               1024 18074  33 290437  99   750   1 21873  39 552006  99   420   0
Latency              7862ms    3316us   32984ms    1483ms     797us   33467ms
1.97,1.97,server,1,1548786028,16G,,448,98,84327,12,45061,7,1112,90,86878,8,72.7,2,1024,,,,,18074,33,290437,99,750,1,21873,39,552006,99,420,0,19506us,4374ms,4166ms,30304us,122ms,4964ms,7862ms,3316us,32984ms,1483ms,797us,33467ms
There is definitely a performance hit there: the test took over 6 hours when running over sshfs, and only a fraction of that locally. Sequential writes are about over 5 times faster and reads are 8 times faster. Creating/reading/deleting lots of small files is especially painful, but in my case I treat the storage as read-only.
A test ran with fio leads other results which are surprising. On the OSMC SSHFS endpoint, I get around 3324KB/s:
osmc@osmc:~$ fio --name=stressant --group_reporting --directory=/mnt/server/osmc/ --size=100M --readwrite=randrw --direct=1 --numjobs=4
stressant: (g=0): rw=randrw, bs=4K-4K/4K-4K/4K-4K, ioengine=psync, iodepth=1
...
fio-2.16
Starting 4 processes
stressant: Laying out IO file(s) (1 file(s) / 100MB)
stressant: Laying out IO file(s) (1 file(s) / 100MB)
stressant: Laying out IO file(s) (1 file(s) / 100MB)
stressant: Laying out IO file(s) (1 file(s) / 100MB)                                                                                                               JobsJobs: 2 (f=2): [_(1),m(2),_(1)] [100.0% done] [2138KB/2298KB/0KB /s] [534/574/0 iops] [eta 00m:00s]
stressant: (groupid=0, jobs=4): err= 0: pid=11394: Mon Jan 28 21:54:34 2019
  read : io=205352KB, bw=3324.9KB/s, iops=831, runt= 61763msec
    clat (msec): min=1, max=3924, avg= 4.62, stdev=62.55
     lat (msec): min=1, max=3924, avg= 4.62, stdev=62.55
    clat percentiles (usec):
     |  1.00th=[ 1512],  5.00th=[ 1816], 10.00th=[ 2008], 20.00th=[ 2256],
     | 30.00th=[ 2448], 40.00th=[ 2608], 50.00th=[ 2800], 60.00th=[ 3024],
     | 70.00th=[ 3280], 80.00th=[ 3600], 90.00th=[ 4128], 95.00th=[ 4640],
     | 99.00th=[ 6880], 99.50th=[21888], 99.90th=[209920], 99.95th=[218112],
     | 99.99th=[3719168]
  write: io=204248KB, bw=3306.1KB/s, iops=826, runt= 61763msec
    clat (usec): min=38, max=2818, avg=105.09, stdev=53.16
     lat (usec): min=39, max=2831, avg=106.92, stdev=53.77
    clat percentiles (usec):
     |  1.00th=[   52],  5.00th=[   59], 10.00th=[   63], 20.00th=[   70],
     | 30.00th=[   77], 40.00th=[   88], 50.00th=[   98], 60.00th=[  104],
     | 70.00th=[  112], 80.00th=[  125], 90.00th=[  147], 95.00th=[  187],
     | 99.00th=[  302], 99.50th=[  346], 99.90th=[  620], 99.95th=[  748],
     | 99.99th=[ 1064]
    lat (usec) : 50=0.17%, 100=25.91%, 250=22.62%, 500=1.08%, 750=0.06%
    lat (usec) : 1000=0.02%
    lat (msec) : 2=4.92%, 4=39.36%, 10=5.48%, 20=0.11%, 50=0.15%
    lat (msec) : 100=0.01%, 250=0.09%, 2000=0.01%, >=2000=0.02%
  cpu          : usr=0.97%, sys=1.35%, ctx=104291, majf=0, minf=138
  IO depths    : 1=100.0%, 2=0.0%, 4=0.0%, 8=0.0%, 16=0.0%, 32=0.0%, >=64=0.0%
     submit    : 0=0.0%, 4=100.0%, 8=0.0%, 16=0.0%, 32=0.0%, 64=0.0%, >=64=0.0%
     complete  : 0=0.0%, 4=100.0%, 8=0.0%, 16=0.0%, 32=0.0%, 64=0.0%, >=64=0.0%
     issued    : total=r=51338/w=51062/d=0, short=r=0/w=0/d=0, drop=r=0/w=0/d=0
     latency   : target=0, window=0, percentile=100.00%, depth=1

Run status group 0 (all jobs):
   READ: io=205352KB, aggrb=3324KB/s, minb=3324KB/s, maxb=3324KB/s, mint=61763msec, maxt=61763msec
  WRITE: io=204248KB, aggrb=3306KB/s, minb=3306KB/s, maxb=3306KB/s, mint=61763msec, maxt=61763msec
But the same test ran directly on the server is over 10 times slower, at around 218KB/s:
root@server:~# sudo -u osmc fio --name=stressant --group_reporting --directory=/srv/osmc --size=100M --readwrite=randrw --direct=1 --numjobs=4
stressant: (g=0): rw=randrw, bs=4K-4K/4K-4K/4K-4K, ioengine=psync, iodepth=1
...
fio-2.16
Starting 4 processes
stressant: Laying out IO file(s) (1 file(s) / 100MB)
stressant: Laying out IO file(s) (1 file(s) / 100MB)
stressant: Laying out IO file(s) (1 file(s) / 100MB)
stressant: Laying out IO file(s) (1 file(s) / 100MB)
Jobs: 1 (f=1): [_(3),m(1)] [99.9% done] [96KB/84KB/0KB /s] [24/21/0 iops] [eta 00m:01s]
stressant: (groupid=0, jobs=4): err= 0: pid=11310: Mon Jan 28 22:14:19 2019
  read : io=205352KB, bw=224047B/s, iops=54, runt=938554msec
    clat (usec): min=190, max=653298, avg=54744.57, stdev=50035.60
     lat (usec): min=191, max=653299, avg=54745.93, stdev=50035.59
    clat percentiles (msec):
     |  1.00th=[    4],  5.00th=[   11], 10.00th=[   15], 20.00th=[   21],
     | 30.00th=[   27], 40.00th=[   34], 50.00th=[   43], 60.00th=[   57],
     | 70.00th=[   69], 80.00th=[   82], 90.00th=[  101], 95.00th=[  123],
     | 99.00th=[  204], 99.50th=[  424], 99.90th=[  523], 99.95th=[  545],
     | 99.99th=[  603]
  write: io=204248KB, bw=222842B/s, iops=54, runt=938554msec
    clat (usec): min=203, max=649080, avg=17813.42, stdev=42354.94
     lat (usec): min=204, max=649082, avg=17814.94, stdev=42354.96
    clat percentiles (usec):
     |  1.00th=[  245],  5.00th=[  302], 10.00th=[  366], 20.00th=[  580],
     | 30.00th=[  868], 40.00th=[ 2704], 50.00th=[ 7264], 60.00th=[12096],
     | 70.00th=[18304], 80.00th=[26752], 90.00th=[40704], 95.00th=[59648],
     | 99.00th=[104960], 99.50th=[423936], 99.90th=[536576], 99.95th=[552960],
     | 99.99th=[593920]
    lat (usec) : 250=0.60%, 500=7.91%, 750=5.25%, 1000=2.43%
    lat (msec) : 2=2.37%, 4=3.57%, 10=7.75%, 20=15.55%, 50=28.83%
    lat (msec) : 100=20.08%, 250=4.93%, 500=0.57%, 750=0.18%
  cpu          : usr=0.05%, sys=0.13%, ctx=103589, majf=0, minf=42
  IO depths    : 1=100.0%, 2=0.0%, 4=0.0%, 8=0.0%, 16=0.0%, 32=0.0%, >=64=0.0%
     submit    : 0=0.0%, 4=100.0%, 8=0.0%, 16=0.0%, 32=0.0%, 64=0.0%, >=64=0.0%
     complete  : 0=0.0%, 4=100.0%, 8=0.0%, 16=0.0%, 32=0.0%, 64=0.0%, >=64=0.0%
     issued    : total=r=51338/w=51062/d=0, short=r=0/w=0/d=0, drop=r=0/w=0/d=0
     latency   : target=0, window=0, percentile=100.00%, depth=1

Run status group 0 (all jobs):
   READ: io=205352KB, aggrb=218KB/s, minb=218KB/s, maxb=218KB/s, mint=938554msec, maxt=938554msec
  WRITE: io=204248KB, aggrb=217KB/s, minb=217KB/s, maxb=217KB/s, mint=938554msec, maxt=938554msec

Disk stats (read/write):
    dm-6: ios=108343/51634, merge=0/0, ticks=3904652/989000, in_queue=4901284, util=100.00%, aggrios=102071/51643, aggrmerge=6184/179, aggrticks=3605260/975972, aggrin_queue=4581132, aggrutil=100.00%
  sdb: ios=102071/51643, merge=6184/179, ticks=3605260/975972, in_queue=4581132, util=100.00%
That’s pretty slow! I suspect something else might have slowed down the test, or that there’s some caching going on in the SFTP layer that the test ran directly on the server cannot leverage. Indeed, a more reasonable test (sequential read/write) yields more similar results. Client hits 4125KB/s:
osmc@osmc:~$ fio --name=stressant --group_reporting --directory=/mnt/server/osmc/ --size=100M --readwrite=readwrite --direct=1 --numjobs=4
stressant: (g=0): rw=rw, bs=4K-4K/4K-4K/4K-4K, ioengine=psync, iodepth=1
...
fio-2.16
Starting 4 processes
Jobs: 2 (f=2): [_(1),M(2),_(1)] [100.0% done] [576KB/704KB/0KB /s] [144/176/0 iops] [eta 00m:00s]
stressant: (groupid=0, jobs=4): err= 0: pid=11649: Mon Jan 28 22:35:04 2019
  read : io=205352KB, bw=4148.6KB/s, iops=1037, runt= 49500msec
    clat (usec): min=897, max=406359, avg=3663.71, stdev=10687.28
     lat (usec): min=898, max=406360, avg=3665.18, stdev=10687.28
    clat percentiles (usec):
     |  1.00th=[ 1512],  5.00th=[ 1832], 10.00th=[ 2024], 20.00th=[ 2256],
     | 30.00th=[ 2448], 40.00th=[ 2640], 50.00th=[ 2864], 60.00th=[ 3088],
     | 70.00th=[ 3344], 80.00th=[ 3696], 90.00th=[ 4256], 95.00th=[ 4832],
     | 99.00th=[ 8768], 99.50th=[34560], 99.90th=[209920], 99.95th=[214016],
     | 99.99th=[257024]
  write: io=204248KB, bw=4126.2KB/s, iops=1031, runt= 49501msec
    clat (usec): min=38, max=2591, avg=102.47, stdev=51.50
     lat (usec): min=39, max=2599, avg=104.28, stdev=51.93
    clat percentiles (usec):
     |  1.00th=[   51],  5.00th=[   58], 10.00th=[   62], 20.00th=[   68],
     | 30.00th=[   75], 40.00th=[   85], 50.00th=[   96], 60.00th=[  103],
     | 70.00th=[  110], 80.00th=[  122], 90.00th=[  143], 95.00th=[  175],
     | 99.00th=[  298], 99.50th=[  350], 99.90th=[  572], 99.95th=[  724],
     | 99.99th=[ 1144]
    lat (usec) : 50=0.26%, 100=27.26%, 250=21.25%, 500=1.03%, 750=0.04%
    lat (usec) : 1000=0.02%
    lat (msec) : 2=4.63%, 4=38.68%, 10=6.37%, 20=0.14%, 50=0.21%
    lat (msec) : 250=0.11%, 500=0.01%
  cpu          : usr=1.01%, sys=1.66%, ctx=104084, majf=0, minf=142
  IO depths    : 1=100.0%, 2=0.0%, 4=0.0%, 8=0.0%, 16=0.0%, 32=0.0%, >=64=0.0%
     submit    : 0=0.0%, 4=100.0%, 8=0.0%, 16=0.0%, 32=0.0%, 64=0.0%, >=64=0.0%
     complete  : 0=0.0%, 4=100.0%, 8=0.0%, 16=0.0%, 32=0.0%, 64=0.0%, >=64=0.0%
     issued    : total=r=51338/w=51062/d=0, short=r=0/w=0/d=0, drop=r=0/w=0/d=0
     latency   : target=0, window=0, percentile=100.00%, depth=1

Run status group 0 (all jobs):
   READ: io=205352KB, aggrb=4148KB/s, minb=4148KB/s, maxb=4148KB/s, mint=49500msec, maxt=49500msec
  WRITE: io=204248KB, aggrb=4126KB/s, minb=4126KB/s, maxb=4126KB/s, mint=49501msec, maxt=49501msec
Server hits 831KB/s, about 5 times slower:
root@marcos:~# sudo -u osmc fio --name=stressant --group_reporting --directory=/srv/osmc --size=100M --readwrite=readwrite --numjobs=4 --direct=1
stressant: (g=0): rw=rw, bs=4K-4K/4K-4K/4K-4K, ioengine=psync, iodepth=1
...
fio-2.16
Starting 4 processes
Jobs: 2 (f=2): [_(2),M(2)] [99.6% done] [832KB/872KB/0KB /s] [208/218/0 iops] [eta 00m:01s]
stressant: (groupid=0, jobs=4): err= 0: pid=19495: Mon Jan 28 22:33:01 2019
  read : io=205352KB, bw=856134B/s, iops=209, runt=245616msec
    clat (usec): min=129, max=146001, avg=18635.62, stdev=18942.67
     lat (usec): min=129, max=146002, avg=18636.92, stdev=18942.62
    clat percentiles (usec):
     |  1.00th=[  175],  5.00th=[  205], 10.00th=[  211], 20.00th=[  223],
     | 30.00th=[  241], 40.00th=[  258], 50.00th=[11072], 60.00th=[35072],
     | 70.00th=[35584], 80.00th=[36096], 90.00th=[37120], 95.00th=[38144],
     | 99.00th=[57088], 99.50th=[68096], 99.90th=[98816], 99.95th=[107008],
     | 99.99th=[134144]
  write: io=204248KB, bw=851532B/s, iops=207, runt=245616msec
    clat (usec): min=198, max=125692, avg=426.80, stdev=2142.22
     lat (usec): min=199, max=125693, avg=428.22, stdev=2142.22
    clat percentiles (usec):
     |  1.00th=[  211],  5.00th=[  225], 10.00th=[  239], 20.00th=[  255],
     | 30.00th=[  262], 40.00th=[  270], 50.00th=[  278], 60.00th=[  290],
     | 70.00th=[  306], 80.00th=[  326], 90.00th=[  350], 95.00th=[  502],
     | 99.00th=[  868], 99.50th=[ 3344], 99.90th=[32640], 99.95th=[40192],
     | 99.99th=[80384]
    lat (usec) : 250=25.50%, 500=46.05%, 750=1.87%, 1000=0.94%
    lat (msec) : 2=0.10%, 4=0.08%, 10=0.17%, 20=0.17%, 50=24.39%
    lat (msec) : 100=0.69%, 250=0.05%
  cpu          : usr=0.09%, sys=0.43%, ctx=102530, majf=0, minf=48
  IO depths    : 1=100.0%, 2=0.0%, 4=0.0%, 8=0.0%, 16=0.0%, 32=0.0%, >=64=0.0%
     submit    : 0=0.0%, 4=100.0%, 8=0.0%, 16=0.0%, 32=0.0%, 64=0.0%, >=64=0.0%
     complete  : 0=0.0%, 4=100.0%, 8=0.0%, 16=0.0%, 32=0.0%, 64=0.0%, >=64=0.0%
     issued    : total=r=51338/w=51062/d=0, short=r=0/w=0/d=0, drop=r=0/w=0/d=0
     latency   : target=0, window=0, percentile=100.00%, depth=1

Run status group 0 (all jobs):
   READ: io=205352KB, aggrb=836KB/s, minb=836KB/s, maxb=836KB/s, mint=245616msec, maxt=245616msec
  WRITE: io=204248KB, aggrb=831KB/s, minb=831KB/s, maxb=831KB/s, mint=245616msec, maxt=245616msec

Disk stats (read/write):
    dm-6: ios=52096/51157, merge=0/0, ticks=980180/23600, in_queue=1004148, util=100.00%, aggrios=51449/51226, aggrmerge=690/32, aggrticks=955344/20240, aggrin_queue=975528, aggrutil=100.00%
  sdb: ios=51449/51226, merge=690/32, ticks=955344/20240, in_queue=975528, util=100.00%
I believe the key is the cache: if we disable direct mode and let the server do its own caching, it definitely outperforms the SSHFS endpoint. Client, 11178KB/s:
osmc@osmc:~$ fio --name=stressant --group_reporting --directory=/mnt/server/osmc/ --size=100M --readwrite=readwrite --numjobs=4
stressant: (g=0): rw=rw, bs=4K-4K/4K-4K/4K-4K, ioengine=psync, iodepth=1
...
fio-2.16
Starting 4 processes
Jobs: 3 (f=3): [M(3),_(1)] [90.0% done] [10598KB/10238KB/0KB /s] [2649/2559/0 iops] [eta 00m:02s]
stressant: (groupid=0, jobs=4): err= 0: pid=11665: Mon Jan 28 22:40:13 2019
  read : io=205352KB, bw=11178KB/s, iops=2794, runt= 18371msec
    clat (usec): min=3, max=207422, avg=692.04, stdev=8703.16
     lat (usec): min=3, max=207423, avg=693.04, stdev=8703.17
    clat percentiles (usec):
     |  1.00th=[    4],  5.00th=[    4], 10.00th=[    5], 20.00th=[    5],
     | 30.00th=[    5], 40.00th=[    6], 50.00th=[    6], 60.00th=[    7],
     | 70.00th=[    9], 80.00th=[   11], 90.00th=[   14], 95.00th=[   20],
     | 99.00th=[10048], 99.50th=[49408], 99.90th=[152576], 99.95th=[173056],
     | 99.99th=[193536]
  write: io=204248KB, bw=11118KB/s, iops=2779, runt= 18371msec
    clat (usec): min=37, max=167522, avg=646.50, stdev=2714.98
     lat (usec): min=38, max=167523, avg=647.81, stdev=2715.04
    clat percentiles (usec):
     |  1.00th=[   46],  5.00th=[   52], 10.00th=[   56], 20.00th=[   64],
     | 30.00th=[   73], 40.00th=[   87], 50.00th=[  110], 60.00th=[  141],
     | 70.00th=[  179], 80.00th=[ 1848], 90.00th=[ 2224], 95.00th=[ 2416],
     | 99.00th=[ 2960], 99.50th=[ 3472], 99.90th=[10816], 99.95th=[82432],
     | 99.99th=[126464]
    lat (usec) : 4=0.07%, 10=36.92%, 20=10.59%, 50=2.45%, 100=21.96%
    lat (usec) : 250=14.82%, 500=1.10%, 750=0.15%, 1000=0.19%
    lat (msec) : 2=2.29%, 4=8.64%, 10=0.27%, 20=0.25%, 50=0.04%
    lat (msec) : 100=0.10%, 250=0.17%
  cpu          : usr=1.29%, sys=2.92%, ctx=59179, majf=0, minf=146
  IO depths    : 1=100.0%, 2=0.0%, 4=0.0%, 8=0.0%, 16=0.0%, 32=0.0%, >=64=0.0%
     submit    : 0=0.0%, 4=100.0%, 8=0.0%, 16=0.0%, 32=0.0%, 64=0.0%, >=64=0.0%
     complete  : 0=0.0%, 4=100.0%, 8=0.0%, 16=0.0%, 32=0.0%, 64=0.0%, >=64=0.0%
     issued    : total=r=51338/w=51062/d=0, short=r=0/w=0/d=0, drop=r=0/w=0/d=0
     latency   : target=0, window=0, percentile=100.00%, depth=1

Run status group 0 (all jobs):
   READ: io=205352KB, aggrb=11178KB/s, minb=11178KB/s, maxb=11178KB/s, mint=18371msec, maxt=18371msec
  WRITE: io=204248KB, aggrb=11117KB/s, minb=11117KB/s, maxb=11117KB/s, mint=18371msec, maxt=18371msec
Server, ~89700KB/s, that is, the original 8-fold performance difference:
root@server:~# sudo -u osmc fio --name=stressant --group_reporting --directory=/srv/osmc --size=100M --readwrite=readwrite --numjobs=4
stressant: (g=0): rw=rw, bs=4K-4K/4K-4K/4K-4K, ioengine=psync, iodepth=1
...
fio-2.16
Starting 4 processes
Jobs: 3 (f=3)
stressant: (groupid=0, jobs=4): err= 0: pid=23136: Mon Jan 28 22:40:17 2019
  read : io=205352KB, bw=90185KB/s, iops=22546, runt=  2277msec
    clat (usec): min=2, max=834095, avg=107.14, stdev=7682.75
     lat (usec): min=2, max=834096, avg=107.90, stdev=7682.78
    clat percentiles (usec):
     |  1.00th=[    2],  5.00th=[    2], 10.00th=[    2], 20.00th=[    2],
     | 30.00th=[    3], 40.00th=[    3], 50.00th=[    3], 60.00th=[    3],
     | 70.00th=[    3], 80.00th=[    4], 90.00th=[    4], 95.00th=[    4],
     | 99.00th=[    7], 99.50th=[  115], 99.90th=[ 2544], 99.95th=[ 5024],
     | 99.99th=[626688]
  write: io=204248KB, bw=89700KB/s, iops=22425, runt=  2277msec
    clat (usec): min=3, max=912823, avg=35.75, stdev=4235.81
     lat (usec): min=3, max=912824, avg=36.62, stdev=4235.84
    clat percentiles (usec):
     |  1.00th=[    3],  5.00th=[    3], 10.00th=[    3], 20.00th=[    4],
     | 30.00th=[    4], 40.00th=[    4], 50.00th=[    4], 60.00th=[    4],
     | 70.00th=[    5], 80.00th=[    5], 90.00th=[    5], 95.00th=[    6],
     | 99.00th=[    8], 99.50th=[   15], 99.90th=[ 1752], 99.95th=[ 2576],
     | 99.99th=[15936]
    lat (usec) : 4=43.64%, 10=55.52%, 20=0.30%, 50=0.12%, 100=0.06%
    lat (usec) : 250=0.11%, 500=0.02%, 750=0.02%, 1000=0.02%
    lat (msec) : 2=0.06%, 4=0.08%, 10=0.01%, 20=0.01%, 50=0.01%
    lat (msec) : 250=0.01%, 750=0.01%, 1000=0.01%
  cpu          : usr=2.99%, sys=7.04%, ctx=573, majf=0, minf=41
  IO depths    : 1=100.0%, 2=0.0%, 4=0.0%, 8=0.0%, 16=0.0%, 32=0.0%, >=64=0.0%
     submit    : 0=0.0%, 4=100.0%, 8=0.0%, 16=0.0%, 32=0.0%, 64=0.0%, >=64=0.0%
     complete  : 0=0.0%, 4=100.0%, 8=0.0%, 16=0.0%, 32=0.0%, 64=0.0%, >=64=0.0%
     issued    : total=r=51338/w=51062/d=0, short=r=0/w=0/d=0, drop=r=0/w=0/d=0
     latency   : target=0, window=0, percentile=100.00%, depth=1

Run status group 0 (all jobs):
   READ: io=205352KB, aggrb=90185KB/s, minb=90185KB/s, maxb=90185KB/s, mint=2277msec, maxt=2277msec
  WRITE: io=204248KB, aggrb=89700KB/s, minb=89700KB/s, maxb=89700KB/s, mint=2277msec, maxt=2277msec

Disk stats (read/write):
    dm-6: ios=233/152, merge=0/0, ticks=10104/110200, in_queue=120288, util=93.35%, aggrios=257/189, aggrmerge=11/5, aggrticks=4500/64196, aggrin_queue=68684, aggrutil=88.16%
  sdb: ios=257/189, merge=11/5, ticks=4500/64196, in_queue=68684, util=88.16%
Almost an order of magnitude faster…
Note that a lot of that overhead is specific to the Vero. During tests on another computer I could almost saturate (but not quite) the gigabit network, something I cannot reproduce on the Vero 4k+. I suspect this might be because Intel processors have special instructions set for cryptographic operations which might be missing from the Vero CPU, which means it needs to run those as normal instructions in the CPU.
Benchmarking the cipher used by default (chacha20) using openssl speed gives the following results, on the Vero:
The 'numbers' are in 1000s of bytes per second processed.
type             16 bytes     64 bytes    256 bytes   1024 bytes   8192 bytes  16384 bytes
vero            47715.23k    96421.80k   217529.96k   240623.22k   248491.58k   249343.66k
server         215857.37k   416072.46k   751905.03k   811660.11k   906759.14k   829639.77k
workstation    245314.57k   441711.83k   918491.99k  1894956.71k  1967540.91k  1973321.73k
So that’s probably the bottleneck. Forcing another, faster cipher would probably help with the performance. For example here are the same results but with AES256:
host             16 bytes     64 bytes    256 bytes   1024 bytes   8192 bytes  16384 bytes
vero4k+         94186.17k   265138.88k   474621.61k   605420.65k   654475.26k   659305.31k
server         137186.89k   169273.62k   181124.07k   183319.34k   185431.77k   184395.53k
workstation    409389.73k   579395.61k   626040.06k   629537.79k   627444.18k   625431.89k
Switching to AES128-CTR gives a two-fold performance increase, for example:
$ sudo sftp osmc@server:/test/1000M /tmp
Connected to server.
Fetching /test/1000M to /tmp/1000M
/test/1000M                                      100%  954MB  19.4MB/s   00:49
$ sudo sftp  -c aes128-ctr osmc@server:/test/1000M /tmp
Connected to osmc.
Fetching /test/1000M to /tmp/1000M
/test/1000M                                      100%  954MB  42.1MB/s   00:22
Which algorithm to pick is left as an exercise for the reader for now. ![]() (Hint: a script like this one will generate nice reports.) But before you go crazy optimizing all of this, keep in mind that a 1080p DVD is 40Mbit/s (5MB/s) and 4k is 128Mbit/s (16MB/s). So even with the default algorithms, it might just be possible to stream 4k videos over SSH.
(Hint: a script like this one will generate nice reports.) But before you go crazy optimizing all of this, keep in mind that a 1080p DVD is 40Mbit/s (5MB/s) and 4k is 128Mbit/s (16MB/s). So even with the default algorithms, it might just be possible to stream 4k videos over SSH.
Anecdotally, it seems the Vero comes pretty close to saturating the gigabit network using a pure network benchmark:
osmc@osmc:~$ iperf3 --client server
Connecting to host server, port 5201
[  4] local 192.168.0.222 port 47802 connected to 192.168.0.223 port 5201
[ ID] Interval           Transfer     Bandwidth       Retr  Cwnd
[  4]   0.00-1.00   sec   110 MBytes   923 Mbits/sec    0   1.85 MBytes
[  4]   1.00-2.00   sec   112 MBytes   941 Mbits/sec    0   2.83 MBytes
[  4]   2.00-3.00   sec   112 MBytes   940 Mbits/sec    0   2.22 MBytes
[  4]   3.00-4.00   sec   112 MBytes   939 Mbits/sec    0   2.40 MBytes
[  4]   4.00-5.00   sec   112 MBytes   940 Mbits/sec    0   2.55 MBytes
[  4]   5.00-6.00   sec   112 MBytes   939 Mbits/sec    0   2.67 MBytes
[  4]   6.00-7.00   sec   112 MBytes   941 Mbits/sec    0   2.77 MBytes
[  4]   7.00-8.00   sec   112 MBytes   939 Mbits/sec    0   2.03 MBytes
[  4]   8.00-9.00   sec   112 MBytes   940 Mbits/sec    0   2.14 MBytes
[  4]   9.00-10.00  sec   112 MBytes   940 Mbits/sec    0   2.22 MBytes
- - - - - - - - - - - - - - - - - - - - - - - - -
[ ID] Interval           Transfer     Bandwidth       Retr
[  4]   0.00-10.00  sec  1.09 GBytes   938 Mbits/sec    0             sender
[  4]   0.00-10.00  sec  1.09 GBytes   935 Mbits/sec                  receiver

iperf Done.
The theoretical maximum bandwidth for a gigabit TCP connection is around 950Mbit/s, or about a 5% overhead. The above tests shows an extra 1-1.5% overhead. So clearly the problem is the encryption layer in SSH which overloads the CPU. But I believe performance is still acceptable for many use cases.