I currently have a problem with my V4K. Quite often while the device is idling (usually over night, but also often during the days) it “crashes”. This happens several times a day with varying frequencies and includes:
No output on HDMI3 (where it is connected)
No SSH to the device possible
Kodi showing as “Offline” in Yatse app
Soundbar Sound+CEC not working anymore
I can fix this by replugging the device power cable. As soon as the V4K boots back up again the soundbar is recognized by the TV and all the CEC is working again. The problem with the CEC is caused by the V4K crashing, while it’s running, everything is working fine.
There were no such problems before (using the V4K since release) and I did not change anything since the problems occur (no new addons, no updates, etc.)
When running sudo journalctl, there is some “red” (see bold below) output, mostly stuff like:
Jan 02 23:11:14 Vero4K kernel: aml_audio_hw: IEC958 PCM32
Jan 02 23:11:14 Vero4K kernel: hdmitx: audio: aout notify rate 44100
Jan 02 23:11:14 Vero4K kernel: hdmitx: audio: aout notify size 32
Jan 02 23:11:14 Vero4K kernel: hdmitx: audio: no update
Jan 02 23:11:14 Vero4K kernel: aml_snd_m8_card aml_m8_snd.46: i2s/958 same source Jan 02 23:11:14 Vero4K kernel: channel count should be 8, we got 2 aborting
Jan 02 23:11:14 Vero4K kernel: aml_snd_m8_card aml_m8_snd.46: I2S playback enable
Jan 02 23:11:14 Vero4K kernel: aml_snd_m8_card aml_m8_snd.46: IEC958 playback enable
Jan 04 14:51:44 Vero4K systemd[1]: Time has been changed
Jan 04 14:51:44 Vero4K http-time[403]: Updated time from Tue Jan 2 22:11:16 UTC 2018 to Thu Jan 4 13:51:44 UTC 2018 using HTTP query to www.google.com
Jan 04 14:51:44 Vero4K systemd[1]: Started Set Time using HTTP query.
Jan 04 14:51:44 Vero4K systemd[1]: Starting LSB: Start NTP daemon…
Jan 04 14:51:44 Vero4K ntpd[819]: ntpd 4.2.6p5@1.2349-o Fri Jul 22 17:59:22 UTC 2016 (1)
Jan 04 14:51:44 Vero4K ntpd[820]: proto: precision = 0.416 usec
Jan 04 14:51:44 Vero4K systemd[1]: Started LSB: Start NTP daemon.
Notice the abrupt ending of the logs after the error. But this should also be visible in the output of grab-logs -A
Do any of you have similar problems, an idea of what is happening or maybe even a fix? If I can provide any more logs, I’d be happy to.
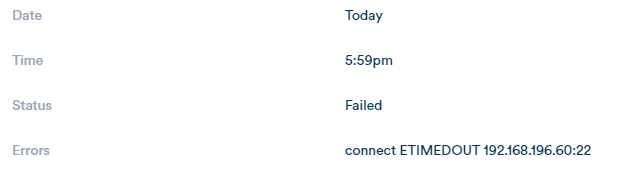
Looks like the network might be dropping.
This can be enough to freeze Kodi sometimes, but shouldn’t cause the device to become unresponsive via SSH unless the network is completely down.
It may be unrelated, but I’ve just had similar symptoms trying play music from NAS. Total lock-up and loss of ssh. Kodi.old.log full of nulls at the end. I think there may have been a network hiccup while the Music Library was updating. I deleted the database and re-scanned and so far so good now. (Library is on vero, not MySQL).
Do you think this could cause such crashes? .50 is the IP of my NAS and while those drops are happening, the NAS was probably in sleep/switched off.
How would I set up /etc/fstab? Willing to give it a try.
Am I still able to wake up the NAS (192.168.196.50) through WOL with fstab? Because this is usually how I do it:
NAS on sleep
WOL through Kodi/V4K
Watch
When finished watching send NAS to sleep again.
The V4K is currently crashed yet again, getting a timeout through SSH
Network is running though (GF is watching Netflix through App on TV, V4K + TV are hooked up to the same switch).
What is irritating to me is that this setup was running since V4K release without a flaw, before that I had it running on a RasPi and RaspBMC - also without a problem and the exact same config (NFS, WOL, etc.)
Edit:
New logs: https://paste.osmc.tv/revegobici - Crash happened during the opening of this post and right now. NAS was switched off during this period (it is turned on via WOL when booting the V4K, but I usually send it to sleep again directly after)
Another edit:
Is there an option to somehow tail the relevant log? I can let the tail run in the background from my computer until it crashes again. Does it help to enable debug logging beforehand?
Also please see above:
Is there an option to somehow tail the relevant log? I can let the tail run in the background from my computer until it crashes again. Does it help to enable debug logging beforehand?
FWIW, I also ran a Library cleanup since some of the freezes (also what @grahamh said) seem to be related to the Library (although everything “automatic” [e.g. refresh etc.) using the library is turned off on my side)
Thanks, I ran both commands you sent and am doing the watch in parallel, only problem is that I cannot scroll in the “watch” terminal, neither in Putty nor in Termius.
Regarding the ping times:
You’re right, up to 1s is weird - misread that as 1s until the timeout.
I currently have no explanation for this, since everything directly on the TV (Netflix etc.) and streaming on the Vero is running without a flaw all the time. Maybe it has something to do with the QoS on the switch (Netflix 4K streaming takes up all the bandwidth, no idea…)
I ran a ping from my PC to the Vero and at the same time to the TV. I got some timeouts when Netflix was streaming on the TV, but other than that the network is looking fine. So I’d give this to the QoS of my switches:
Results:
PC → Vero:
Pakete: Sent = 2139, Received = 2101, Lost = 38 (1% Loss),
Times:
Min = 0ms, Max = 1ms, Avg = 0ms
PC → TV:
Pakete: Sent = 2216, Received = 2200, Lost = 16 (0% Loss),
Times:
Min = 0ms, Max = 2ms, Avg = 0ms
There was zero congestion on the network this time; TV was off, so no Netflix etc…
Any help? I still have the persistent journal (no idea what to do with it). Is it possible the “Cleanup of Temporary Directories” overloads it somehow? Heat problem? No idea… I always see the “Started” message, but never a message that says it’s finished.
To access the previous system journal run sudo journalctl -b -1. If you want to go back two journals it’s sudo journalctl -b -2, etc. (For completeness, -b 1 is the first saved journal (in chronological order), -b 2 is the second, etc, and -b is the journal starting from the latest boot.)
I seriously doubt this is a network issue… As said, directly after the WOL procedure of the NAS I’m seeing some “higher pings”, but after a very short time (when the NAS is completely booted) the pings are going down to 0.xx ms.
I just ran a ping from V4K to the NAS and I got:
— 192.168.196.50 ping statistics —
69 packets transmitted, 69 packets received, 0% packet loss
round-trip min/avg/max = 0.646/0.687/0.846 ms
The crash is happening whether there is a lot of traffic on the network or not, so even on a full idle network (in the middle of the night) I’m losing the device.
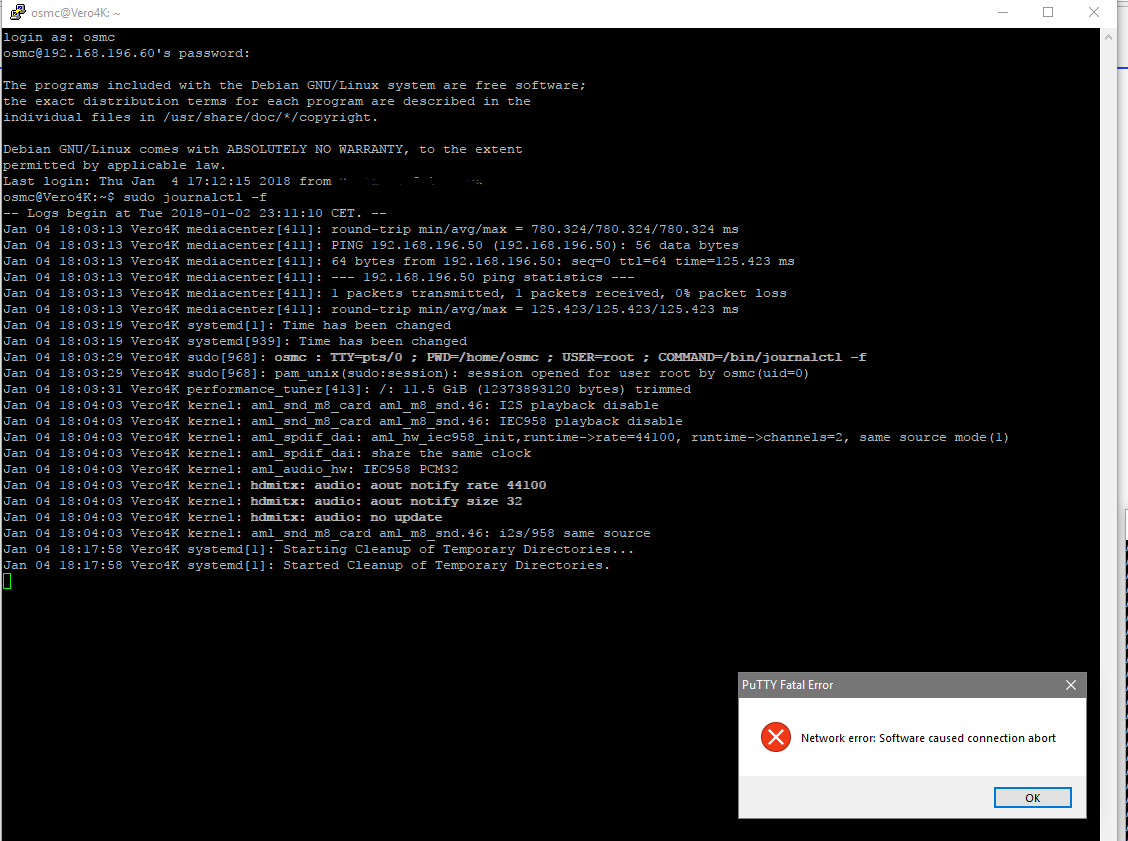
sudo journalctl -b -2 is giving me the info I had in my Putty (crash somewhere between 18:50 and 19:05), nothing else:
Jan 04 18:04:03 Vero4K kernel: aml_spdif_dai: share the same clock
Jan 04 18:04:03 Vero4K kernel: aml_audio_hw: IEC958 PCM32
Jan 04 18:04:03 Vero4K kernel: hdmitx: audio: aout notify rate 44100
Jan 04 18:04:03 Vero4K kernel: hdmitx: audio: aout notify size 32
Jan 04 18:04:03 Vero4K kernel: hdmitx: audio: no update
Jan 04 18:04:03 Vero4K kernel: aml_snd_m8_card aml_m8_snd.46: i2s/958 same source
Jan 04 18:17:58 Vero4K systemd[1]: Starting Cleanup of Temporary Directories…
Jan 04 18:17:58 Vero4K systemd[1]: Started Cleanup of Temporary Directories.
sudo journalctl -b -1 is the most recent start, it gives me logs from 21:20 with “high ping” to the NAS (as said, this is only during the WOL and shortly after the NAS is fully started up).
I cannot find anything else in the logs.
I have now enabled Debug- and Event-Logging and will wait for the next crash… Hopefully we will be able to get some more information.
Uptime in both cases is 14 days (power outage). These are much closer to what I’d expect to see.
I don’t know what Netflix will be using but I’d expect that with gigabit LAN it wouldn’t even break into a sweat. Something else will be causing the dropped packets. As @ActionA says, try a different cable or a different port on the switch. Also beware of broadcast storms.