@sam_nazarko TL;DR: I am sure you know the guts of the hardware and the eth0 adapter has been selected after careful consideration. Are there any Interrupt coalescing, ring buffers etc. we could turn on to make the system process more packets in less interrupts and use the CPU in bigger batches more efficiently? Or maybe CRC, TCP/IP etc. offloading that can be turned on for this adapter?
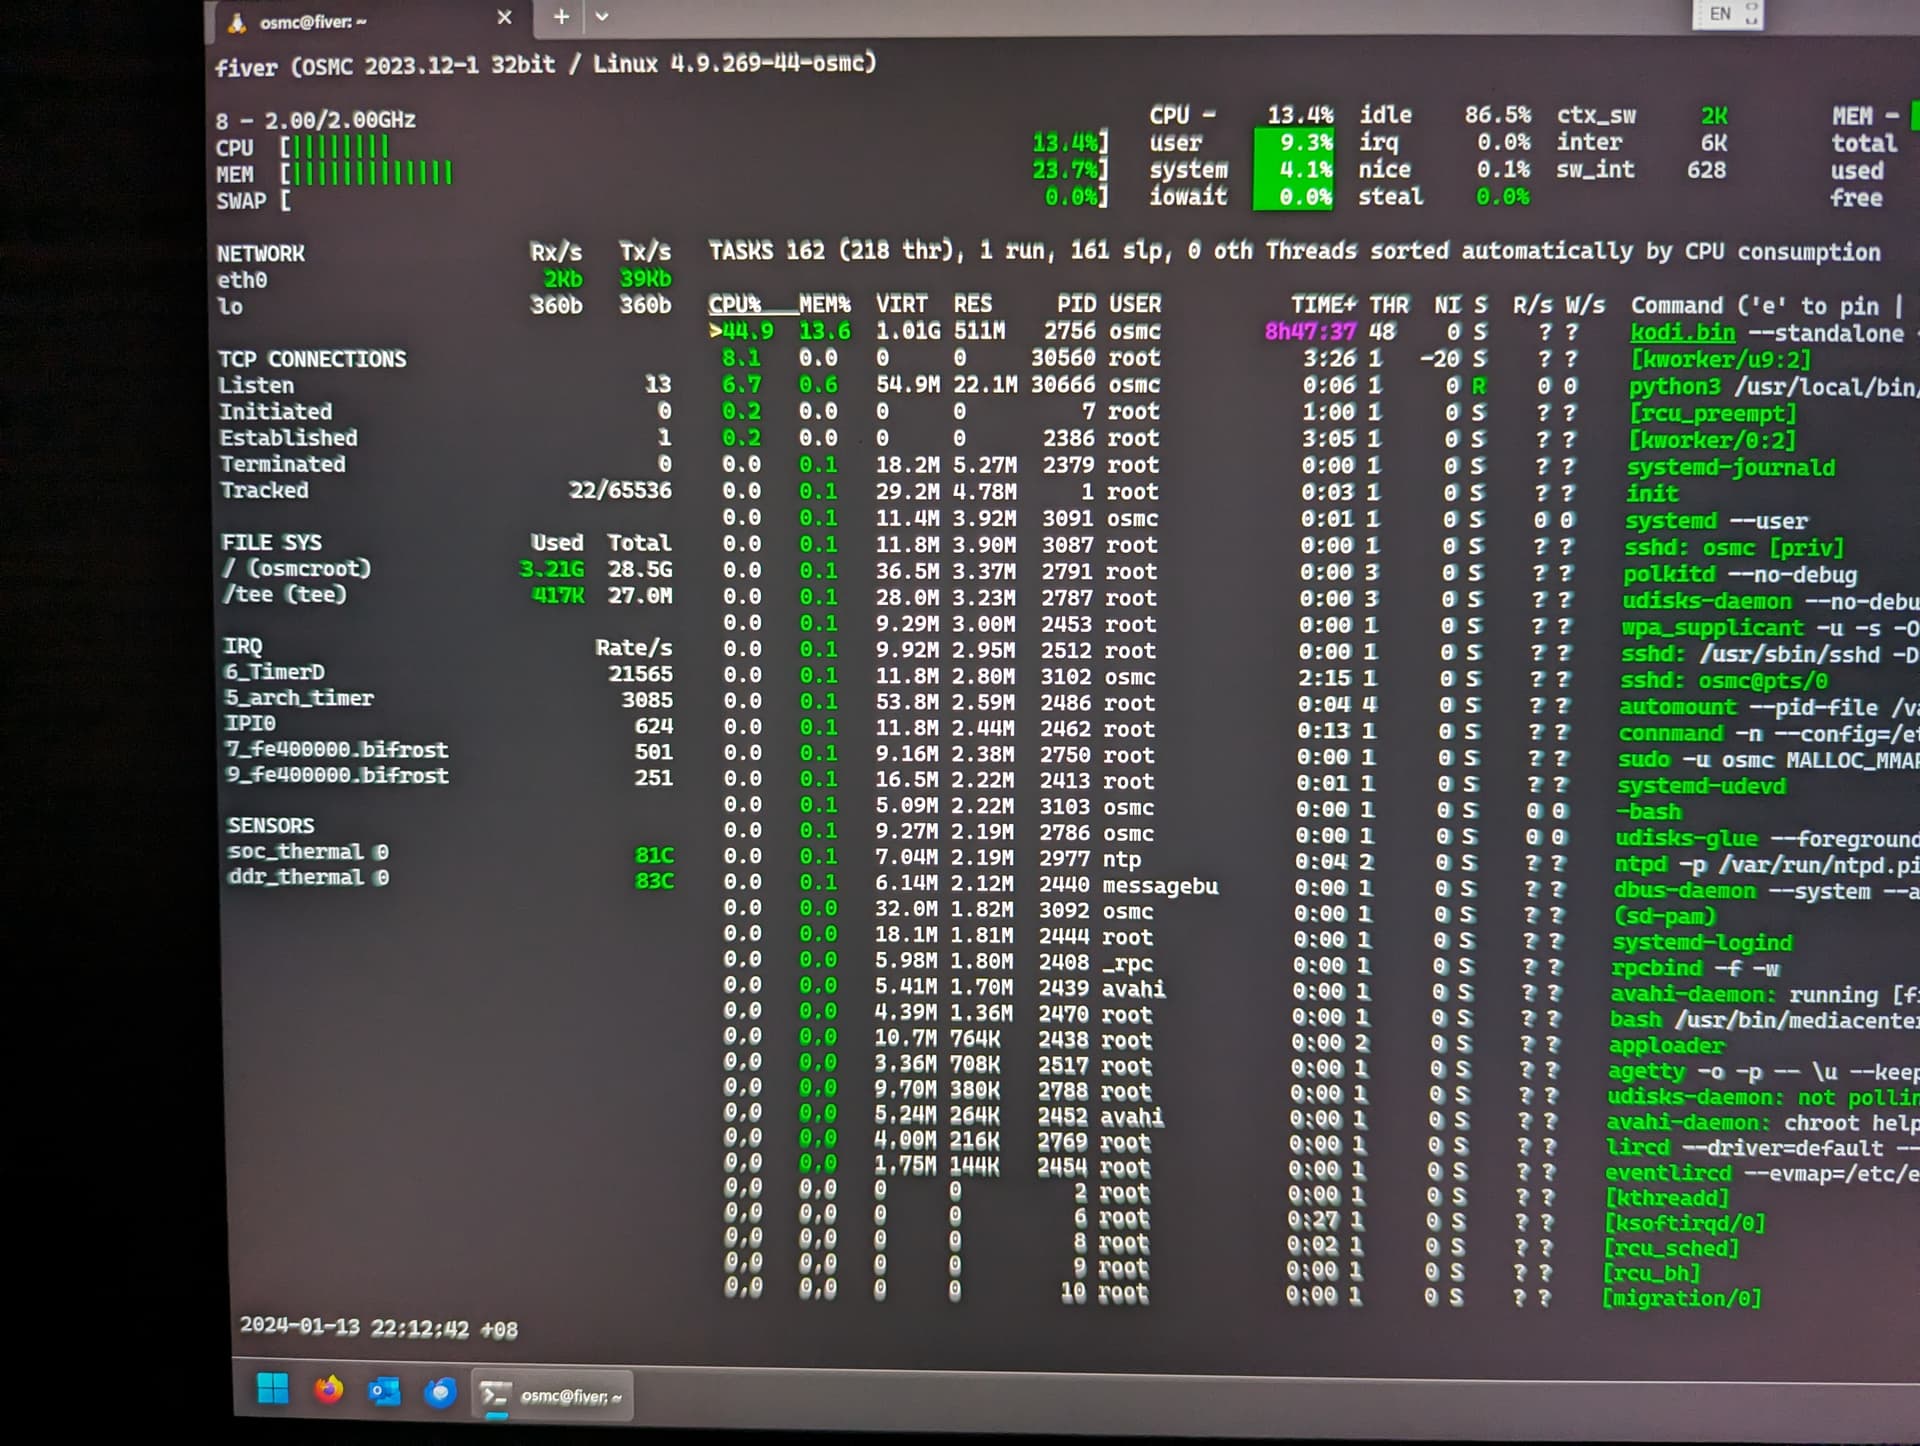
This is just a low level feedback trying to help. Because of another library scanning and scraping freezing issue (which I will post in another thread once I reproduced it with debug logging) I am monitoring my Vero V and have seen with glances and later powertop that it has an immense number of interrupts: up to 29k-32k/sec (without debug logging, below is observed with debug logging enabled) from the network adapter:
IRQ                           Rate/s
6_TimerD                       22755
5_arch_timer                    3806
IPI0                            2038
7_fe400000.bifrost               504
16_eth0                          346
Estimated by powertop to be 60% of the approx. 5W total system budget:
Power est.              Usage       Events/s    Category       Description
  3.00 W      1.7 ms/s     759.7        Interrupt      [6] Meson TimerD
And it does not have a huge amount of traffic: 1462 pkts/s Network interface: eth0 (meson6-dwmac)
for comparison my AMD Ryzen Linux server serving this Vero and another and doing a lot of other stuff usually has ~3k interrupts/sec in the entire system.
Maybe this is also a reason why Vero V just sitting idle and scanning library and scraping can heat up to 90C+ even though I have already put pencils under the sides to ease bottom airflow:
soc_thermal 0                    91C
ddr_thermal 0                    93C
1 Like
>90C!
Impressive.
What’s your ambient temperature in the environment?
Ambient temperature 28-32C daytime in the house, living ~1.5° from the equator…
Also answering one of my own questions: seems like all the offloading that can be turned on in this Ethernet driver already is, including scatter-gather, except for TCP segmentation.
osmc@fiver:~$ sudo ethtool -k eth0|grep -v 'off \[fixed\]'
Features for eth0:
rx-checksumming: on
tx-checksumming: on
        tx-checksum-ipv4: on
        tx-checksum-ipv6: on
scatter-gather: on
        tx-scatter-gather: on
tcp-segmentation-offload: off
generic-segmentation-offload: on
generic-receive-offload: on
rx-vlan-offload: on [fixed]
highdma: on [fixed]
tx-nocache-copy: off
Wonder is there is anything else like increasing network or driver queue or buffer sizes that can help? 
1 Like
The external PHY is an RTL8211F
Since Vero 2, I’ve chosen PHY solutions that can be tweaked to provide consistent and perfect performance even under system duress.
The driver is optimised to provide separate ring buffers for TX and RX. We also have offload and coalescing to further performance.
This PHY was judiciously chosen and we even pay a premium for it. But it’s the same PHY we have in Vero 4K+ and its reliability is proven.
If you are watching while scraping, it will generate a bit of heat, yes. Otherwise I wouldn’t worry.
Ambient temperatures shouldn’t have much of an impact. The other half has been using a Vero V since the start of 2023 and she can see temperature of -30C in Winter and in the Summer 45C. Obviously she’s not sitting there freezing or boiling to death but the device should have behave independent of external temps (within reason)
TL;DR: buth the high temperature and the high number of interrupts is normal for this specific device.
Interrupts yes, temperature not specifically.
I have just checked my device and it’s idling at 46. Your temperatures aren’t standard but by your own admission you are scraping a library and taxing the CPU. You didn’t state whether you are playing video during this as asked before.
The temperatures you are hitting won’t impact the longevity of the device and are not critical.
Nope, not playing anything.
Rebooted it into debug mode and haven’t touched it. Not playing anything, even have not even received a single HID event from the remote.
Scan library upon boot is turned on and it’s doing that since the morning (it’s 10pm now), sitting on the desk with two pencils allowing more airflow to the underside.
I’d keep an eye on things; but unless you have some stability issues I wouldn’t particularly worry about it.
A bit hard to follow because some of your reports are also in the 4.9 kernel thread; but I would check:
- Does setting UI back to 1080p lower temps?
- What skin are you using, are there any dynamic elements like an RSS feed etc?
- Does temperature drop if you stop Kodi (systemctl stop mediacenter)
Hi, default osmc skin, no RSS.
I will try setting the UI back to 1080p and stopping Kodi after having produced the logs for the library scan freeze! 
I want to leave the box as untouched as possible, probably better for the cleaner logs.
Yes that would help. 4K UI is pretty new and has a couple of corner cases (mainly with whitelisting).
We haven’t extensively studied the increased load it puts on the device. Vero V should handle it OK, but 4K/4K+ will struggle a bit in terms of performance.
Interestingly enough the library scan seems to have completed and I do not feel like erasing the entire lib and restart with debug logging just to catch the freeze… 
I wanted to give you the debug log, but it became too large:
Dispatching logs ...
Exception Details:

Traceback (most recent call last):
  File "/usr/bin/grab-logs", line 1051, in dispatch_logs
    raise Exception('Log file too large for upload')
Exception: Log file too large for upload

Failed to upload log files, copying to /boot instead. (Unable to verify)
osmc@fiver:~$ grab-logs -A
Any alternative command line to make it smaller?
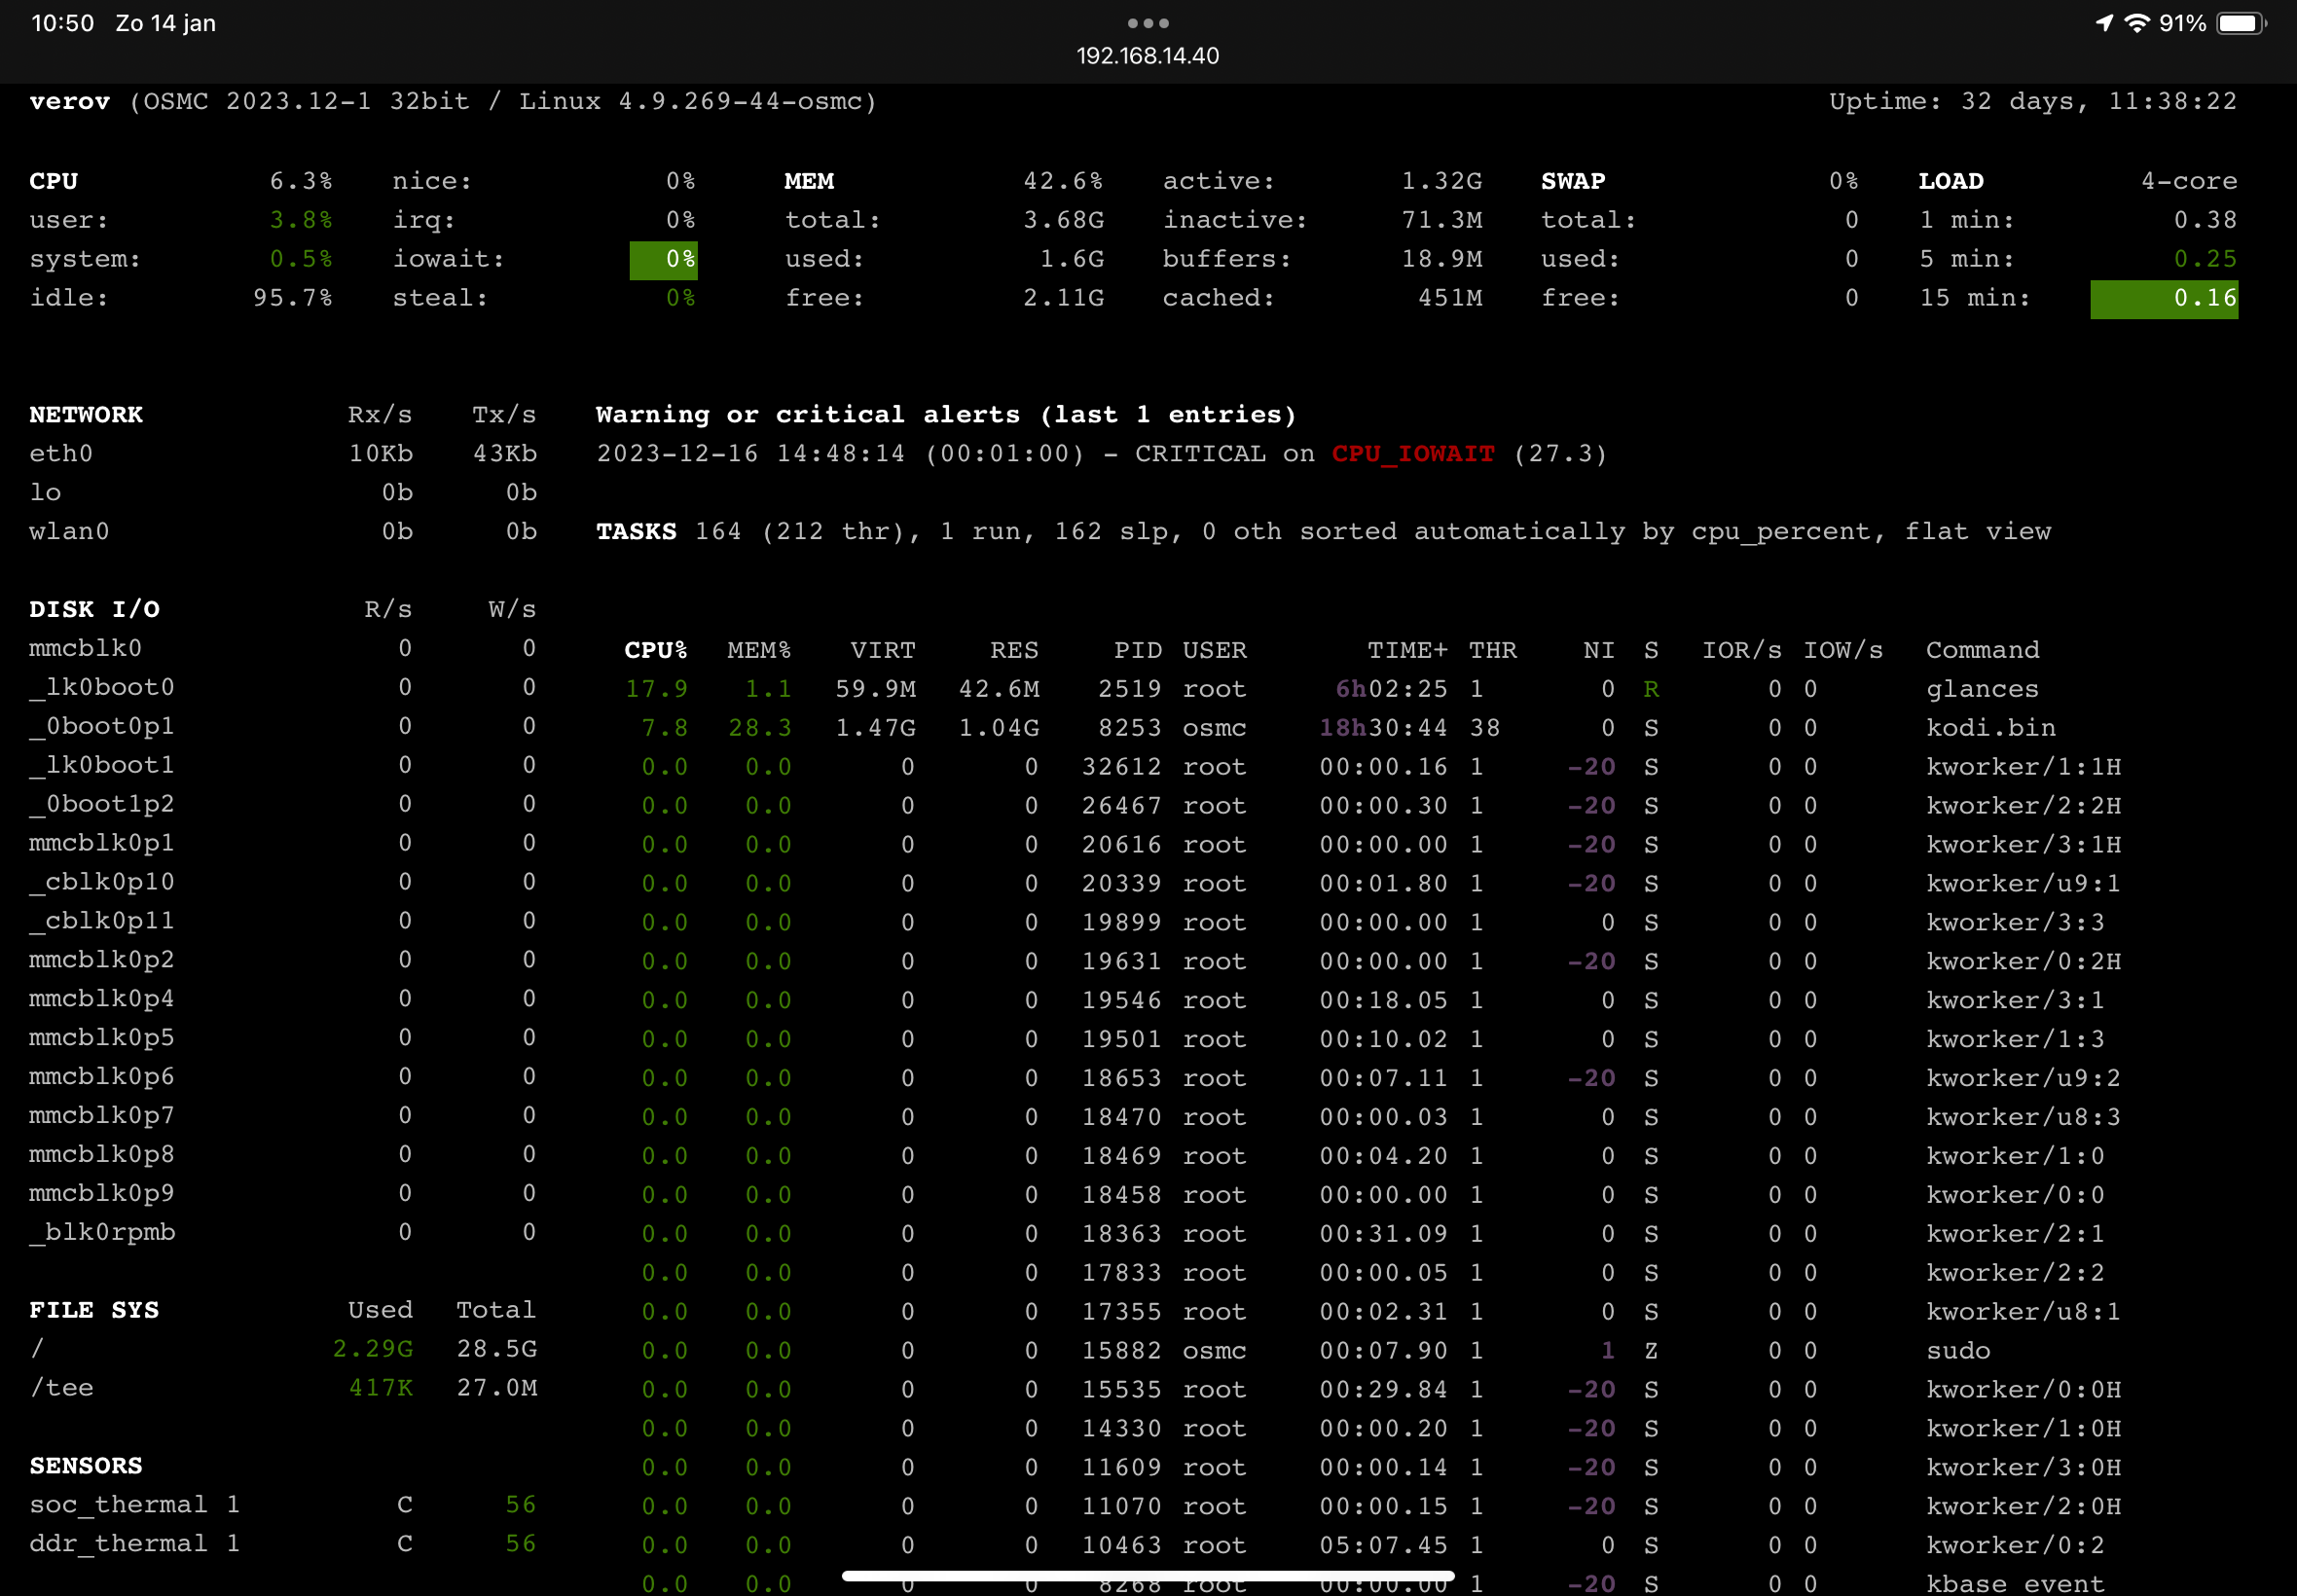
This is totally idling after scanning finished, but still with 4k UI.
Now I have turned it back to 1080p and will get back to you if it cooled off. Still don’t understand the 20k interrupts on a idle system with almost no network traffic 
After I had waited a while Kodi idling still with 1080p UI 79 and 80C (SOC and DDR)
now I have systemctl stop mediacenter and will take a look again soon.
I can confirm it was kodi, after systemctl stop mediacenter temps went down to 65C and 67C.
I think you would pretty much need to manually cut out from that file the bulk of the library scan to get that logset sized down. This would probably be easiest done on a PC and not at the terminal since I don’t think discovering the line numbers to cut or a regex pattern is possible blind in this case.
maybe use tail to get the last 10000 lines?
And / or use LZMA to compress?
But where are the temporarily collected files stored?
It is literally in the message you posted above
But if your just after Kodi.log or kodi.old.log then you can grab them directly from ~/.kodi/temp
I think the current limit is something like 10Mb for paste.osmc.tv. You can upload individual files with paste-log. More information can be found in the following wiki…
I use glances as well to integrate it within Home Assistant, just to compare 
I don’t have any issues and am running in 1080p UI btw.
I found it in /boot, but its kind of irritating that you are willing to type a longer sentence instead of being helpful and typing 5 characters: /boot.
My Vero V is not idling at 62/64C SOC/DDR, which is not that far from the 56/56 of @Theetjuh’s screenshot, so I will leave it at that and get started on the other problems I am having, thanks for the responses.